
PUBLIC
SAP HANA Platform 2.0 SPS 07
Document Version: 1.0–2024-07-26
SAP HANA Troubleshooting and Performance
Analysis Guide
© 2024 SAP SE or an SAP aliate company. All rights reserved.
THE BEST RUN
Content
1 SAP HANA Troubleshooting and Performance Analysis Guide.......................... 5
2 Analyzing Generic Symptoms...................................................8
2.1 Using the SQL Statement Collection for Analysis and Health Checks.........................8
2.2 Handling SQL Errors..........................................................10
SQL Error Reference........................................................12
2.3 Performance and High Resource Utilization..........................................43
2.4 Common Symptoms and Troubleshooting.......................................... 45
Slow System-wide Performance...............................................45
Slow Individual SQL Statements...............................................55
Frequent Out of Memory (OOM)...............................................59
Table Consistency Check....................................................62
3 Root Causes and Solutions....................................................65
3.1 Memory Problems........................................................... 65
Memory Information in SAP HANA Cockpit.......................................66
Memory Information from Logs and Traces....................................... 66
Memory Information from SQL Commands.......................................68
Memory Information from Other Tools...........................................73
Root Causes of Memory Problems..............................................73
3.2 CPU Related Root Causes and Solutions............................................82
Indicators of CPU Related Issues...............................................82
Analysis of CPU Related Issues................................................83
Resolving CPU Related Issues.................................................84
Retrospective Analysis of CPU Related Issues......................................86
Controlling Parallel Execution of SQL Statements ...................................87
Apply NUMA Node Anity Settings.............................................89
Basic NUMA Analysis.......................................................93
3.3 Disk Related Root Causes and Solutions...........................................106
Reclaiming Disk Space..................................................... 110
Analyze and Resolve Internal Disk-Full Event (Alert 30)...............................112
3.4 I/O Related Root Causes and Solutions............................................ 114
Analyzing I/O Throughput and Latency..........................................116
Savepoint Performance.....................................................118
3.5 Conguration Parameter Issues.................................................123
Issues with Conguration Parameter log_mode (Alert 33)............................124
3.6 Backup And Recovery........................................................125
2
PUBLIC
SAP HANA Troubleshooting and Performance Analysis Guide
Content
3.7 Delta Merge............................................................... 129
Inactive Delta Merge.......................................................130
Indicator for Large Delta Storage of Column Store Tables.............................131
Failed Delta Merge........................................................134
Delta Storage Optimization..................................................135
3.8 Post-Installation Problems with Web IDE...........................................136
3.9 Troubleshooting BW on HANA...................................................137
3.10 Troubleshooting Multi-Dimensional Services Queries..................................149
3.11 License Issues..............................................................153
System Locked Due to Missing, Expired, or Invalid License............................154
License Problem Identication and Analysis......................................154
Resolution of License Issues.................................................155
3.12 Security-Related Issues.......................................................156
Troubleshooting Authorization Problems........................................ 156
Troubleshooting Problems with User Name/Password Authentication....................162
Troubleshooting Problems with User Authentication and SSO..........................164
3.13 Transactional Problems.......................................................167
Blocked Transactions ......................................................167
Multiversion Concurrency Control (MVCC) Issues..................................175
Version Garbage Collection Issues.............................................178
3.14 Statement Performance Analysis................................................180
SQL Statement Optimization.................................................182
Analysis of Critical SQL Statements............................................184
Optimization of Critical SQL Statements........................................ 190
3.15 Application Performance Analysis................................................198
SQL Trace Analysis........................................................198
Statement Measurement...................................................199
Data Analysis........................................................... 200
Source Analysis..........................................................201
Technical Analysis........................................................203
3.16 System Hanging Situations....................................................204
Transparent Huge Pages on Linux.............................................204
CPU Power Saving........................................................206
3.17 Troubleshoot System Replication................................................207
Replication Performance Problems............................................208
Setup and Initial Conguration Problems........................................212
Log Shipping Timeout......................................................217
Troubleshooting Cluster Management Problems...................................218
LogReplay: Managing the Size of the Log File.....................................220
3.18 Network Performance and Connectivity Problems....................................223
Network Performance Analysis on Transactional Level...............................223
SAP HANA Troubleshooting and Performance Analysis Guide
Content
PUBLIC 3
Stress Test with NIPING....................................................226
Application and Database Connectivity Analysis...................................226
SAP HANA System Replication Communication Problems............................229
SAP HANA Inter-Node Communication Problems..................................230
3.19 SAP HANA Dynamic Tiering....................................................232
Tools and Tracing.........................................................232
Query Plan Analysis.......................................................233
Data Loading Performance..................................................235
4 Tools and Tracing.......................................................... 237
4.1 System Performance Analysis..................................................237
4.2 SQL Statement Analysis......................................................238
Analyzing SQL Traces......................................................238
Analyzing Expensive Statements Traces.........................................243
Analyzing SQL Execution with the SQL Plan Cache.................................246
4.3 Query Plan Analysis......................................................... 248
Analyzing SQL Execution with the Plan Explanation.................................248
Analyzing SQL Execution with the Plan Visualizer..................................252
4.4 Result Cache.............................................................. 267
Static Result Cache.......................................................268
Dynamic Result Cache.....................................................273
4.5 Advanced Analysis..........................................................280
Analyzing Column Searches (qo trace)..........................................281
Analyzing Table Joins......................................................282
SQL Plan Stability........................................................ 283
4.6 Additional Analysis Tools for Support.............................................288
Performance Trace........................................................288
Kernel Proler...........................................................290
Diagnosis Information..................................................... 292
Analysis Tools in SAP HANA Web-based Developer Workbench........................ 292
5 SAP HANA Database monitoring with Solution Manager............................ 296
6 Alerts and the Statistics Service..............................................300
6.1 Alerts Reference............................................................301
7 SAP HANA SQLDBC Error Codes.............................................. 350
8 Important Disclaimer for Features in SAP HANA...................................358
4
PUBLIC
SAP HANA Troubleshooting and Performance Analysis Guide
Content
1 SAP HANA Troubleshooting and
Performance Analysis Guide
With SAP HANA, you can analyze data at incredible speeds, for example, with scans of 1 billion rows per second
per core and join performance of 10 million rows per second. However, such results are only possible if the
system is monitored and performance issues are kept to a minimum.
This guide describes the measures you can take to identify and resolve specic performance issues and shows
you how to enhance the performance of your SAP HANA database in the following areas:
• Host resources (CPU, memory, disk)
• Size and growth of data structures
• Transactional problems
• SQL statement performance
• Security, authorization, and licensing
• Conguration.
Prerequisites
• This guide assumes knowledge of the relevant functionality of the SAP HANA database (knowledge which
can be gained from HANA training courses such as HA100, HA200).
• Access to the administration tool SAP HANA cockpit (or alternatively SAP HANA studio) is required.
Overview
Analyzing Generic Symptoms
This section of the troubleshooting guide helps you to nd out about causes of generic problems such as:
• slow system-wide performance
• slow individual SQL statements
• frequent out-of-memory (OOM) situations
Furthermore, you are directed to sections of this guide that contain more specic root causes.
SAP Note references lead you to possible solutions.
Analyzing Generic Symptoms [page 8]
Root Causes & Solutions
In this section of the troubleshooting guide you nd concrete root causes for problems together with possible
solutions. Some of the areas covered are:
SAP HANA Troubleshooting and Performance Analysis Guide
SAP HANA Troubleshooting and Performance Analysis Guide
PUBLIC 5
• Memory Problems
• CPU Related Root Causes and Solutions
• License Issues
• Statement Performance Analysis
You may nd the SAP Notes very useful for solving your issue as they contain detailed explanations and
step-by-step instructions, for example.
Root Causes and Solutions [page 65]
Tools and Tracing
This section of the troubleshooting guide presents monitoring tools which can be used for analyzing and
tracing certain issues.
Tools and Tracing [page 237]
Apart from those more specic monitoring tools discussed here, there are important tools for administrators
and developers in general:
• SAP HANA cockpit
Tip
For the documentation of the latest SAP HANA cockpit support package (SP), see https://
help.sap.com/viewer/p/SAP_HANA_COCKPIT
• SAP HANA database explorer
SAP HANA Database Explorer
• SQL analyzer
Analyzing Statement Performance
• Support Log Assistant
The Support Log Assistant is a tool that allows you to automatically scan and analyze text les such as
logs, conguration les or traces. The tool will then suggest solutions to known issues found in the les
and highlight important details that it nds. The tool is integrated into the incident logging procedure and is
also available as a standalone tool; the following link is to a Support Portal getting started page which also
gives direct access to the Support Log Assistant.
Support Log Assistant
Alerts
Alert checkers run in the background and you are notied in case of potentially critical situations arising in your
system. In the SAP HANA cockpit, you can easily see in which areas you might need to take some action.
Alerts Reference [page 301]
SAP Notes
SAP Notes are used to give detailed supplementary customer support information in addition to the formal
set of published documents. This troubleshooting guide includes many references to relevant SAP Notes. The
Alerts reference section, for example, gives links to corresponding notes for each system alert. Some other
FAQ-format SAP Notes which you may nd useful are listed here:
• SAP Note 2000003 - FAQ: SAP HANA
• SAP Note 1999997 - FAQ: SAP HANA Memory
6
PUBLIC
SAP HANA Troubleshooting and Performance Analysis Guide
SAP HANA Troubleshooting and Performance Analysis Guide

• SAP Note 2186744 - FAQ: SAP HANA Parameters
Guided Answers
Guided Answers is an interactive online support tool to help users to diagnose and solve problems using
decision trees. It covers many SAP products including SAP HANA and oers a set of step-by-step problem-
solving online documents each one designed to address a specic topic. Guided Answers is available in the
SAP Support portal at the following address:
https://ga.support.sap.com/dtp/viewer/
This troubleshooting guide includes links to specic trees where relevant. The following tree is a general
high-level troubleshooting tree for SAP HANA:
https://gad5158842f.us2.hana.ondemand.com/dtp/viewer/#/tree/1623/actions/21021
Further Resources
The following SAP HANA documents are important resources for working with SAP HANA and are often
referred to in this guide:
• SAP HANA Administration Guide
• SAP HANA SQL and System Views Reference
In particular, the SAP HANA Administration Guide gives general details on using the administration tools SAP
HANA cockpit and SAP HANA studio.
There is a central online portal for a variety of support resources for SAP products which is available
from the SAP ONE Support Launchpad Software Downloads : https://launchpad.support.sap.com/#/
softwarecenter
In the SAP Community Network (SCN) you can nd many support resources online including wikis, blogs,
reference materials and so on. This SCN wiki page, for example, provides links to many specialist topics: SAP
HANA In-Memory Troubleshooting Guide .
Both SAP HANA Academy and SAP Support oer YouTube channels with a wide range of support materials in
video format:
• https://www.youtube.com/user/saphanaacademy
• http://www.youtube.com/user/SAPSupportInfo
SAP HANA Troubleshooting and Performance Analysis Guide
SAP HANA Troubleshooting and Performance Analysis Guide
PUBLIC 7
2 Analyzing Generic Symptoms
The purpose of this section of the document is to help you to nd the probable root cause of some generic
problems and refer you to more detailed sections of the SAP HANA Troubleshooting and Performance Analysis
Guide to proceed with your analysis.
Performance issues may be dicult to diagnose; problems may be rooted in a number of seemingly unrelated
components. Checking for system alerts is a good starting point if you experience any trouble with your SAP
HANA system. If the system issues an alert, refer to the Reference: Alerts section to nd the part of this guide,
an SAP Note or Knowledge Base Article which addresses the problem.
However, alerts are congurable (see Memory Problems for information on conguring alerts) and do not cover
all aspects of the system, problems can still occur without triggering an alert. This section therefore describes
some generic symptoms which you may observe and helps you to analyze the underlying problem.
Related Information
Memory Problems [page 65]
Alerts Reference [page 301]
2.1 Using the SQL Statement Collection for Analysis and
Health Checks
A collection of predened customizable statements is available for checking the database.
An extensive SQL statement collection is available for analyzing the SAP HANA database, this can be used
to examine specic problems or for routine monitoring. The script collection is available in a zip le attached
to the SAP Note 1969700 SQL Statement Collection for SAP HANA. Several scripts are referred to in this
Troubleshooting Guide but a general starting point for system analysis is to check the overall health of the SAP
HANA database by running the script HANA_Conguration_MiniChecks as illustrated below.
Identify the Correct Version of a Script
Many of the statements are version specic, you must therefore choose the correct version of the script for the
version and database revision of SAP HANA you are running. For example, if you are on SAP HANA 2.00.023
and script versions 2.00.000+, 2.00.010+, and 2.00.030+ are available, you should use the 2.00.010+ version.
Script versions for earlier releases than your database release are expected to work, but you should avoid using
script version for SAP HANA releases later than the release you are using. They may describe monitoring views
or columns not yet available with your SAP HANA version.
8
PUBLIC
SAP HANA Troubleshooting and Performance Analysis Guide
Analyzing Generic Symptoms

Modify a Script
Where relevant, the SQL support scripts contain sections which can be customized to enter your own
parameter values, these are marked with the comment '/* Modification section */'. For example:
( SELECT /* Modification section */
'%' HOST,
'%' PORT,
'%' OBJECT_TYPE, ...
)
If you want to analyze a specic time range, you can modify the time parameters using the codes described in
the comment block of the script, in the section INPUT_PARAMETERS . You can use 'C-H12' BEGIN_TIME, or
you can enter a specic date and time.
To do this, in place of 'C-H12' BEGIN_TIME and 'C' END_TIME, enter the date and time you want to
analyze, in the format 'YYY/MM/DD HH24:MI:SS'.
Example: To check for transaction lock waits that happened between 19/08/2022 at 2pm and 20/08/2022 at
2pm, the modication part of the script would look like this:
Script HANA_Conguration_MiniChecks
The output of the HANA_Conguration_MiniChecks script is illustrated here; the output report gives an
overview of the overall health of the SAP HANA database. The report covers various aspects of the system
including Memory, CPU, I/O, locks and other issues that may cause a performance problem. If a potentially
critical issue is found the column ‘C’ is marked with an ‘X’. The last column of the report references relevant
SAP notes or Knowledge Base Articles that will help you to resolve the issues.
SAP HANA Troubleshooting and Performance Analysis Guide
Analyzing Generic Symptoms
PUBLIC 9
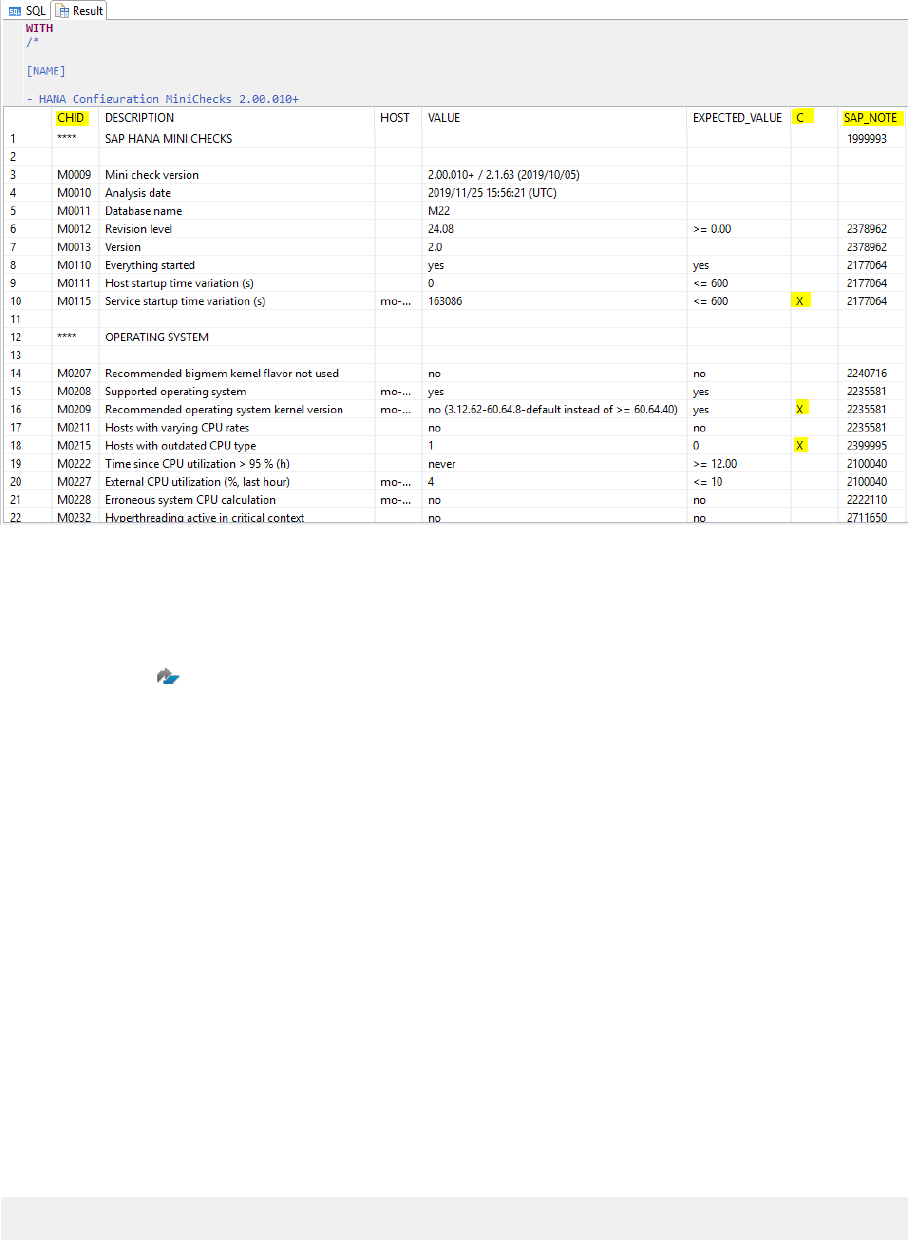
Example Output of the Conguration_MiniChecks Script
Related Information
SAP Note 1969700
2.2 Handling SQL Errors
Errors generated when executing SQL statements are identied by a code number which may be helpful to nd
an explanation and solution to the problem.
This section gives some recommended solutions to help solve problems related to SQL errors. The topic which
follows 'SQL Error Reference' is a table of error codes which includes links to other sources of information for
many of the most frequently occurring errors.
Error messages returned when executing SQL statements are identied by a number, type and description, for
example:
ERROR [SQL-608] exceed maximum number of prepared statements
There are currently over 5700 SQL errors; all error codes and types are listed in the monitoring view
M_ERROR_CODES. To get a complete list of errors and their descriptions you can execute the following query:
SELECT * FROM M_ERROR_CODES ORDER BY CODE ASC;
All SQL error messages are also listed in the help topic 'SQL Error Codes' in the SAP HANA SQL Reference
Guide for SAP HANA Platform (link in Related Information below).
10
PUBLIC
SAP HANA Troubleshooting and Performance Analysis Guide
Analyzing Generic Symptoms

Knowledge Base Search
You can search for existing support documentation on a specic error in the SAP HANA Support Knowledge
Base and the SAP Support community (see links in Related Information below). For example, the search
results for the description of the SQL-608 error given above includes references to many HAN-DB (SAP HANA
Database) knowledge base articles such as:
• 2464140 - Longer running realtime replication may provide errors like "exceed maximum number of
prepared statements"
• 2154870 - How-To: Understanding and dening SAP HANA Limitations
SQL errors may also be related to third party SAP tools, middleware or application clients that use HANA, and
information may therefore be available under other component IDs (not only 'HAN-DB*'). The following error,
for example, may occur in the context of 'SAP Access Control 12.0' between SPRO and HANA:
ERROR_CODE : 4.229 - ERR_PROVIDER_INVALID_PROVIDER_NAME - 'Invalid provider name'
The following KBA (under the component Access Request GRC-SAC-ARQ) may be relevant but may not be
immediately visible in the search results:
• 3002042 - Invalid provider name: 'SAP_PI_GRC'.'Create_User': line xx col xx (at pos xx): line x col xx (at
pos xx)
If no solution can be found you may need to open a support ticket under the HAN-DB* component with the
example system trace les, logs and screenshots of the error(s) for further analysis.
Search Trace Files
You can also search the HANA service trace and service alert les (see also 'Analyzing SQL Traces') for
example: 'indexserver_saphana01.30003.024.trc', 'indexserver_alert_saphana01.trc'.
For errors in BW on HANA, the values of the following transaction codes may also be helpful:
• The ABAP Dumps in transaction code ST22
• The work process trace entry from transaction code ST11
The following articles may also be helpful when analyzing trace les:
• 2194685 - How to nd work process trace for SM21 System Log or ST22 dump
• 2380176 - FAQ: SAP HANA Database Trace
• 2399990 - How-To: Analyzing ABAP Short Dumps in SAP HANA Environments
Related Information
SQL Error Codes (SAP HANA SQL Reference Guide)
SQL Error Reference [page 12]
Analyzing SQL Traces [page 238]
SAP HANA Support Knowledge Base
SAP HANA Troubleshooting and Performance Analysis Guide
Analyzing Generic Symptoms
PUBLIC 11
Links to Knowledge Base Articles :
SAP Note 2194685
SAP Note 2380176
SAP Note 2399990
SAP Note 2464140
SAP Note 2154870
SAP Note 3002042
2.2.1SQL Error Reference
The following reference table provides links to sources of troubleshooting information for many frequently
occurring SQL errors.
SQL Error Codes
Code
Type Description
More information
4 FATAL_OUT_OF_MEMORY Cannot allocate
enough memory
This error indicates an out-of-memory (OOM)
situation. - KBA 1999997 - FAQ: SAP HANA
Memory
7 ERR_FEATURE_NOT_SUPPORTED Feature not supported
Common preamble to a more detailed error.
Please review the error detail following the pre-
amble "feature not supported: ...." and search
the SAP HANA Knowledge base for existing
Knowledge based articles and SAP Notes.
Some examples:
2970997 - feature not supported: Invalid op-
tions
2804287 - feature not supported: Create da-
tabase command on SYSTEMDB only
2870701 - Error "feature not supported:
global temporary table must be empty to drop"
2661916
- feature not supported: Snapshot
backup not supported on a tenant database
2710915 - feature not supported: move with-
out partition not allowed on partitioned table
8 ERR_INV_ARGUMENT Invalid argument
3104969 - DBSQL_SEMREQ_ERROR. 22 In-
valid argument. (Internal KBA)
12 PUBLIC
SAP HANA Troubleshooting and Performance Analysis Guide
Analyzing Generic Symptoms
Code Type Description
More information
10 ERR_AUTHENTICATION_FAILED Authentication failed
This error indicates a failure during user authen-
tication - (See KBA 2399990 )
See section '11. How can tracing be activated for
security topics like authorization, authentication
and login?' - 2159014 - FAQ: SAP HANA Se-
curity
11 ERR_INV_STATE Invalid state
2399990 - How-To: Analyzing ABAP Short
Dumps in SAP HANA Environments.
12 ERR_FILE_OPEN_FAILED Cannot open le
Issue with a backup le in the backup catlog or
a data / redo log le in the persistence directory
on the HANA data and log volumes. Check the
underlying HANA services that use persistence
and their trace les for more information on the
error.
15 ERR_FILE_NOT_FOUND Cannot nd le
Typically an issue with a third party backint tool:
2801380 - ERROR: [110063] The backup
destination header is corrupt
2541007 - Not able to restore database from
Symantec NetBackup if the backup le name
contains square brackets
18 ERR_SERVICE_SHUTDOWN Service shutting down
Indicates that a HANA service has been sent
a shutdown command either manually from
<sid>adm, or a parent process like the sap-
start service, daemon or nameserver. Check the
HANA service trace les for the events leading
up to the error.
19 ERR_INV_LICENSE Invalid license
19: invalid license' is described in more detail
in SAP KBA 2399990 - How-To: Analyzing
ABAP Short Dumps in SAP HANA Environments
20 ERR_CON_OUTSIDE_VALID-
ITY_PERIOD
Connect attempt out-
side user's validity pe-
riod
Connect attempt outside user's validity peri-
od' is described in more detail in SAP KBA
2380176 - FAQ: SAP HANA Database Trace
21 ERR_PERSISTENCE Persistence error
Persistence error' is described in more detail
in SAP KBA 2399990 - How-To: Analyzing
ABAP Short Dumps in SAP HANA Environments
SAP HANA Troubleshooting and Performance Analysis Guide
Analyzing Generic Symptoms
PUBLIC 13
Code Type Description
More information
128 ERR_TX Transaction error
SQL error 128: transaction error: exceed maxi-
mum number of transactions' is described in
further detail in KBA 2154870 - How-To: Un-
derstanding and dening SAP HANA Limitations
129 ERR_TX_ROLLBACK Transaction rolled back
by an internal error
This is a quite generic message that something
went wrong and the transaction had to be rolled
back. Check the HANA service trace les for
related detailed error messages.
131 ERR_TX_ROLLBACK_LOCK_TIME-
OUT
Transaction rolled back
by lock wait timeout
SAP KBAs:
3066406 - SQL code: 131" occurred while
accessing table
1999998 - FAQ: SAP HANA Lock Analysis
2380176 - FAQ: SAP HANA Database Trace
132 ERR_TX_ROLLBACK_RESOURCE Transaction rolled back
due to unavailable re-
source
SAP KBAs:
2399990 - How-To: Analyzing ABAP Short
Dumps in SAP HANA Environments
2380176 - FAQ: SAP HANA Database Trace
2154870 - How-To: Understanding and den-
ing SAP HANA Limitations
133 ERR_TX_ROLLBACK_DEADLOCK Transaction rolled back
by detected deadlock
This type of short dump indicates a deadlock, so
a cross-wise transactional lock. In most cases
deadlocks are caused by inadequate application
coding that results in risk of cross-wise locking
of dierent transactions.
See 1999998 - FAQ: SAP HANA Lock Analy-
sis
138 ERR_TX_SERIALIZATION Transaction serializa-
tion failure
This error indicates that a retry for a database
request was triggered, but the request is not
retriable.
This trace error can be linked to "138: trans-
action serialization failure: Serialization failure"
errors observed on client side (SAP KBA
2399990 )
139 ERR_TX_ROLLBACK_QUERY_CAN-
CEL
Current operation can-
celed by request and
transaction rolled back
SAP Note 2931813 - Memory Related Error
or Warning Trace Messages when Cancelling a
Query
14 PUBLIC
SAP HANA Troubleshooting and Performance Analysis Guide
Analyzing Generic Symptoms
Code Type Description
More information
142 ERR_TX_EXCEED_MAX_TX_NUM Exceed max num
of concurrent transac-
tions
This error is generated if the limit of congured
external connections is reached. See SAP KBAs:
2154870 - How-To: Understanding and den-
ing SAP HANA Limitations
1910159 - How to handle HANA Alert 25:
‘Check number of connections’
144 ERR_TX_ROLLBACK_UNIQUE_VIO-
LATED
Transaction rollback
unique constraint vio-
lated
See '19. Which error messages exist in the con-
text of indexes?' - 2160391 - FAQ: SAP HANA
Indexes
145 ERR_TX_DIST_FAILURE Transaction distribu-
tion work failure
Multiple , generic causes. See KBAs:
2399990 - How-To: Analyzing ABAP Short
Dumps in SAP HANA Environments
2380176 - FAQ: SAP HANA Database Trace
146 ERR_TX_LOCK_ACQUISITION_FAIL Resource busy and
NOWAIT specied
This error indicates that an operation is per-
formed with a NOWAIT option and so it termi-
nates immediately in case the transactional ob-
ject or record lock can't be acquired.
See KBAs for more information:
1999998 - FAQ: SAP HANA Lock Analysis
2380176 - FAQ: SAP HANA Database Trace
149 ERR_TX_DIST_2PC_FAILURE Distributed transaction
commit failure
This error indicates major problems on server
side, so the SAP HANA database should be in-
vestigated.
154 ERR_TX_INDEX_HANDLE_AC-
QUISITION_FAIL
failure in acquiring in-
dex handle
This error indicates an index handle contention
issue (SAP Note 1999998 ) accessing a mon-
itoring view like M_CS_NSE_ADVISOR.
SAP Note - 3125519 - Querying
M_CS_NSE_ADVISOR Might Fail and Not Pro-
duce Any Recommendation
256 ERR_SQL sql processing error
[256]: sql processing error:' is a generic error
and needs further investigation via the HANA
service traces.
2073630 - DBIF_RSQL_SQL_ERROR SQL er-
ror 256 when access table
2380176 - FAQ: SAP HANA Database Trace
SAP HANA Troubleshooting and Performance Analysis Guide
Analyzing Generic Symptoms
PUBLIC 15
Code Type Description
More information
257 ERR_SQL_PARSE sql syntax error
This error indicates a wrong syntax and you
need to check the related SQL statement for
correctness.
In rare cases the issue can also be a conse-
quence of problems on lower layers (infrastruc-
ture / hardware) erroneously modifying SQL
statement strings.
SAP KBA 2399990 - How-To: Analyzing
ABAP Short Dumps in SAP HANA Environments
258 ERR_SQL_INSUFF_PRIV insucient privilege
Authorization / permission problems. This ter-
mination indicates missing privileges. Make sure
that proper roles and privileges are assigned.
2399990 - How-To: Analyzing ABAP Short
Dumps in SAP HANA Environments
2380176 - FAQ: SAP HANA Database Trace
2159014 - FAQ: SAP HANA Security
259 ERR_SQL_INV_TABLE invalid table name
This error indicates that the table or view <ob-
ject> isn't found.
2399990 - How-To: Analyzing ABAP Short
Dumps in SAP HANA Environments
260 ERR_SQL_INV_COLUMN invalid column name
This error indicates that column <column>
doesn't exist in table <table> and so the da-
tabase operation <op> (e.g. 'INS' for INSERT)
fails.
2399990 - How-To: Analyzing ABAP Short
Dumps in SAP HANA Environments
261 ERR_SQL_INV_INDEX invalid index name
2399990 - How-To: Analyzing ABAP Short
Dumps in SAP HANA Environments
2142945 - FAQ: SAP HANA Hints
2800008 - FAQ: SAP HANA Fulltext Indexes
262 ERR_SQL_INV_QUERY invalid query name
ODBC_SQL* queries are built-in database quer-
ies (installed when the SAP HANA database is
created) that are used for certain ODBC driver
related actions, e.g. ODBC_SQL_COLUMNS for
retrieving column metadata. The error indicates
that the query isn't available. Check why it is
missing or not properly accessible.
16 PUBLIC
SAP HANA Troubleshooting and Performance Analysis Guide
Analyzing Generic Symptoms
Code Type Description
More information
264 ERR_SQL_INV_DATATYPE invalid datatype
21. Are there restrictions in processing LOB col-
umns?' - 2220627 - FAQ: SAP HANA LOBs
2222219 - SAP HANA Errors and dierent
Results due to Design Changes
2765864 - Update Statement Fails With Er-
ror "invalid datatype: $rowid$ of invalid data
types"
266 ERR_SQL_INCNST_DATATYPE inconsistent datatype
2486755 - "inconsistent datatype: lob type
comparison" when selecting from a column with
type TEXT - HANA DB
2222219 - SAP HANA Errors and dierent
Results due to Design Changes
268 ERR_SQL_AMBG_COLUMN column ambiguously
dened
2695943 - SQL failed with error "column am-
biguously dened"
2552712 - The Error "column ambiguously
dened" May Occur When a Statement is Exe-
cuted
269 ERR_SQL_MANY_VALUES too many values
This error indicates that a database operation
is executed with a wrong number of arguments,
e.g.:
SAP KBA 2399990 - How-To: Analyzing
ABAP Short Dumps in SAP HANA Environments
270 ERR_SQL_FEW_VALUES not enough values
This error indicates that a database operation
is executed with a wrong number of arguments,
e.g.:
SAP KBA 2399990 - How-To: Analyzing
ABAP Short Dumps in SAP HANA Environments
272 ERR_SQL_DPLC_COLUMN duplicate column
name
Column name already exists in the table
SAP HANA Troubleshooting and Performance Analysis Guide
Analyzing Generic Symptoms
PUBLIC 17
Code Type Description
More information
274 ERR_SQL_INS_LARGE_VALUE inserted value too
large for column
This error indicates that a value was inserted
in a column that is larger than the maximum
column value size, e.g.:
2399990 - How-To: Analyzing ABAP Short
Dumps in SAP HANA Environments
2380176 - FAQ: SAP HANA Database Trace
2222219 - SAP HANA Errors and dierent
Results due to Design Changes
3018823
- Inserted Value Too Large For Col-
umn
2725050
- SqlScript Execution Fails With
"[274]: inserted value too large for column"
286 ERR_SQL_LONG_IDENTIFIER identier is too long
Identier are names for SAP HANA objects like
table, column or user.
2154870 - How-To: Understanding and den-
ing SAP HANA Limitations
2170441 - Query on SDA object fails with Er-
ror "ORA-00972: identier is too long"
287 ERR_SQL_NOT_NULL cannot insert NULL or
update to NULL
This error happens when a NULL value is in-
serted into a column that doesn't allow NULL
values, e.g. because of a NOT NULL or primary
key constraint.
2399990 - How-To: Analyzing ABAP Short
Dumps in SAP HANA Environments
2380176 - FAQ: SAP HANA Database Trace
288 ERR_SQL_EXST_TABLE cannot use duplicate
table name
2800007 - FAQ: SAP HANA Temporary Ta-
bles
2562930 - SAP HANA Local Temporary Ta-
ble existence boundaries
292 ERR_SQL_FEW_ARGUMENT wrong number of argu-
ments
This error indicates that a database operation
is executed with a wrong number of arguments,
e.g.:
2399990 - How-To: Analyzing ABAP Short
Dumps in SAP HANA Environments
18 PUBLIC
SAP HANA Troubleshooting and Performance Analysis Guide
Analyzing Generic Symptoms
Code Type Description
More information
293 ERR_SQL_INV_ARGUMENT argument type mis-
match
Can occur during catalog consistency checks
and during HAN service removal from the topol-
ogy:
2116157 - FAQ: SAP HANA Consistency
Checks and Corruptions
2342394 - Unable to remove additional index
server
2504698 - Removing additional indexserver
services fails with error on a SAP HANA system
301 ERR_SQL_UNIQUE_VIOLATED unique constraint vio-
lated
This error indicates that a modication isn't
possible because the key already exists. Check
the existing unique and primary keys and make
sure that duplicates aren't processed.
2380176 - FAQ: SAP HANA Database Trace
2572224 - How-To: Repairing SAP HANA Ta-
bles
2160391 - FAQ: SAP HANA Indexes
302 ERR_SQL_INV_CHAR_VAL invalid CHAR or VAR-
CHAR value
This error indicates a wrong character encoding
and is typically caused by a data corruption.
See SAP Note 2116157 in order to check the
consistency of the database (with a particular
focus on the table returning the error) and take
appropriate actions to repair inconsistencies.
303 ERR_SQL_INV_DATETIME_VAL "invalid DATE TIME or
TIMESTAMP value"
This error indicates that a value <value> can't
be parsed as date, time or timestamp. This
problem can be caused by wrong data in under-
lying tables or inadequate application design.
2399990 - How-To: Analyzing ABAP Short
Dumps in SAP HANA Environments
2380176 - FAQ: SAP HANA Database Trace
2361364 - [303]: invalid DATE, TIME or
TIMESTAMP value: search table error: [6931] at-
tribute value is not a date or wrong syntax
304 ERR_SQL_DIV_BY_ZERO division by zero unde-
ned
2399990 - How-To: Analyzing ABAP Short
Dumps in SAP HANA Environments
2945199 - search table error: [6859] Attribu-
teEngine: divide by zero
2548692 - Alert in HANA Studio '[3] 304
division by zero undened: search table error:
[6859] AttributeEngine: divide by zero'
SAP HANA Troubleshooting and Performance Analysis Guide
Analyzing Generic Symptoms
PUBLIC 19
Code Type Description
More information
305 ERR_SQL_SINGLE_ROW single-row query re-
turns more than one
row
This termination indicates that more than 1 re-
cord is returned although only a single row can
be used. It is typically caused by a coding error
on application side.
2399990 - How-To: Analyzing ABAP Short
Dumps in SAP HANA Environments
2380176 - FAQ: SAP HANA Database Trace
306 ERR_SQL_INV_CURSOR invalid cursor
These termination indicates a lack of memory
on SAP HANA server side.
2399990 - How-To: Analyzing ABAP Short
Dumps in SAP HANA Environments
307 ERR_SQL_NUM_OUT_OF_RANGE numeric value out of
range
This termination indicates an overow while
processing decimal numbers. Adjust the appli-
cation, data or column precision in order to
make sure that overows no longer happen.
2399990 - How-To: Analyzing ABAP Short
Dumps in SAP HANA Environments
2380176 - FAQ: SAP HANA Database Trace
308 ERR_SQL_EXST_COLUMN column name already
exists
A CREATE or ALTER statement processing an
existing table column may encounter this during
a DDL operation.
310 ERR_SQL_IN_PROC sql error in procedure
2647960 - Checks after phase
MAIN_NEWBAS/JOB_RS_DMO_HDB_CON-
TENT_ACTIVATE were negative for Delivery
Unit A2EESNHI_DELIVERY_UNIT
311 ERR_SQL_DROP_ALL_COLUMNS cannot drop all col-
umns in a table
Restriction for issuing a DROP command for all
columns in a database table
313 ERR_SQL_INV_SEQ invalid sequence
6. Which problems exist in context of sequen-
ces?' - 2600095 - FAQ: SAP HANA Sequen-
ces
314 ERR_SQL_OVERFLOW_NUMERIC numeric overow
This error is returned if you use a higher number
precision than dened for the column. Either
reduce the precision on application side or in-
crease the precision in the database.
2399990 - How-To: Analyzing ABAP Short
Dumps in SAP HANA Environments
2380176 - FAQ: SAP HANA Database Trace
20 PUBLIC
SAP HANA Troubleshooting and Performance Analysis Guide
Analyzing Generic Symptoms
Code Type Description
More information
320 ERR_SQL_LOB_INDEX cannot create index on
expression with data-
type LOB
21. Are there restrictions in processing LOB col-
umns?' - 2220627 - FAQ: SAP HANA LOBs
324 ERR_SQL_EXST_SEQ cannot use duplicate
sequence name
2134323 - Nesting error in
SQLRUN_ISU_TRIGGERS: maximum depth 8
325 ERR_SQL_ESC_SEQ invalid escape se-
quence
2399990 - How-To: Analyzing ABAP Short
Dumps in SAP HANA Environments
328 ERR_SQL_INV_FUNC_PROC invalid name of func-
tion or procedure
This error indicates that an object (e.g. table)
accessed in a database request doesn't exist.
Make sure that the application only accesses
objects that exist on SAP HANA level.
2399990 - How-To: Analyzing ABAP Short
Dumps in SAP HANA Environments
2380176 - FAQ: SAP HANA Database Trace
332 ERR_SQL_INV_USER invalid user name
2433879 - Restricted User getting "Invalid
User Name/Password"
2354866 - "Could Not Save the Connection
Data; Invalid User Name or Password"
2506777 - Unable to login after resetting the
SYSTEM user's password for HANA
2538907
- Error "Logon to SAP System Host
failed" when using updated password to log on
HANA system
2764976 - 10: authentication failed: ERR_AU-
THENTICATION_FAILED SQLSTATE: 28000
338 ERR_SQL_ZERO_LEN_NOT_AL-
LOWED
zero-length columns
are not allowed
HANA does not support zero-length columns.
2674281 - Error "SAP DBTech JDBC: [338]:
zero-length columns are not allowed:"
339 ERR_SQL_INV_NUMBER invalid number
This termination indicates that a number was
expected but something else was found.
2399990 - How-To: Analyzing ABAP Short
Dumps in SAP HANA Environments
2972659 - Reason for error "339: invalid
number"
SAP HANA Troubleshooting and Performance Analysis Guide
Analyzing Generic Symptoms
PUBLIC 21
Code Type Description
More information
340 ERR_SQL_VAR_NOT_BOUND not all variables bound
This termination indicates an issue with bind
variable processing. See SAP Note 2380176
-> "unbound parameter: <cnt> of <total>,
<cnt> out of <total_batch> batches" for more
details.
2399990 - How-To: Analyzing ABAP Short
Dumps in SAP HANA Environments
2380176 - FAQ: SAP HANA Database Trace
348 ERR_SQL_INV_DATETIME_FOR-
MAT
invalid datetime format
2271717 - SAP HANA SDA: Error executing
query [Oracle][ODBC]Invalid datetime format.
2933606 - SDA Oracle Remote Query Fails
With [Oracle][ODBC]Invalid datetime format
349 ERR_SQL_CREATE_UNIQUE_IN-
DEX
cannot CREATE
UNIQUE INDEX; dupli-
cate key found
2838779 - Error "duplicate key found" when
trying to recreate a missing primary index
359 ERR_SQL_STR_LENGTH_TOO_LAR
GE
string is too long
2399990 - How-To: Analyzing ABAP Short
Dumps in SAP HANA Environments
2380176 - FAQ: SAP HANA Database Trace
2154870 - How-To: Understanding and den-
ing SAP HANA Limitations
2222219
- SAP HANA Errors and dierent
Results due to Design Changes
361 ERR_SQL_VIEW_UPDATE_VIOLA-
TION
data manipulation op-
eration not legal on
this view
2738610 - How to truncate or delete rows
from sys.table_placement - SAP HANA
2638028 - Behavior Correction of Invalid Up-
datable View Creation
362 ERR_SQL_INV_SCHEMA invalid schema name
This error indicates that the specied schema
name is invalid. Make sure that you specify an
existing schema name and that you are author-
ized to access the schema.
2535951 - FAQ: SAP HANA Users and Sche-
mas
2399990 - How-To: Analyzing ABAP Short
Dumps in SAP HANA Environments
2380176 - FAQ: SAP HANA Database Trace
22 PUBLIC
SAP HANA Troubleshooting and Performance Analysis Guide
Analyzing Generic Symptoms
Code Type Description
More information
378 ERR_SQL_INV_COLUMN_VIEW invalid column view
This error is known in the context of BW tables:
2134076 - Report RS_BW_POST_MIGRA-
TION failing after migrating to the SAP HANA
database
2315758 - Error 2048 creation of column
view failed when executing report RSDDB_LOGI-
NDEX_CREATE
2114556 - Error 2999 has occurred in the
BWA/SAP HANA server
382 ERR_SQL_COLLECT_ALL_VER-
SIONS
fail to collect all version
garbage
Indicates blcoked garbage collection issues. See
KBA 2169283 - FAQ: SAP HANA Garbage
Collection
383 ERR_SQL_INV_IDENTIFIER invalid identier
This error indicates that a wrong identier was
used. Check the related SQL statement for cor-
rectness.
2399990 - How-To: Analyzing ABAP Short
Dumps in SAP HANA Environments
2572224 - How-To: Repairing SAP HANA Ta-
bles
2160391 - FAQ: SAP HANA Indexes
2606638
- How to deal with error "invalid
identier: _sys_ prex not allowed"
2728304
- "ALTER SEQUENCE" command
fails with error: "invalid identier: _sys_ prex
not allowed"
384 ERR_SQL_TOO_LONG_CONSTANT string is too long
2399990 - How-To: Analyzing ABAP Short
Dumps in SAP HANA Environments
2380176 - FAQ: SAP HANA Database Trace
2154870 - How-To: Understanding and den-
ing SAP HANA Limitations
2222219
- SAP HANA Errors and dierent
Results due to Design Changes
391 ERR_SQL_INV_USABLE_VIEW invalidated view
This error indicates that the view <view> is in-
valid. This can e.g. happen if the denition of
an underlying object changed or an object was
dropped. You have to make sure that the view
is consistent and valid or avoid accesses / drop
the view.
2985592 - Database returned the SQL code
391. Error text: invalidated view
SAP HANA Troubleshooting and Performance Analysis Guide
Analyzing Generic Symptoms
PUBLIC 23
Code Type Description
More information
396 ERR_SQL_EXST_USER_DE-
FINED_TYPE
cannot use duplicate
user-dened type
name
2223237 - Troubleshooting HANA Embed-
ded Statistics Server Migration - decision tree
2122188 - ESS disabled due to duplicate cre-
ation of TT_MAIL_COLLECTOR
397 ERR_SQL_INV_OBJ_NAME invalid object name
This error indicates that an object isn't found
with the specied name (and schema).
2399990 - How-To: Analyzing ABAP Short
Dumps in SAP HANA Environments
2380176 - FAQ: SAP HANA Database Trace
398 ERR_SQL_MANY_ORDER_BY cannot have more than
one order by
Only one ORDER BY clause is allowed in a state-
ment
402 ERR_SQL_DROPPED_USER the user was already
dropped before query
execution
2819401 - Errors Related to the _SYS_XB
User and Schema When Running the SAP HANA
System Migration Tool to Migrate From SAP
HANA 1.0 to SAP HANA 2.0 on IBM Power
403 ERR_SQL_INTERNAL_ERROR internal error
Generic preamble. Check the HANA service
traces and ABAP dump traces for further infor-
mation on the error.
406 ERR_SQL_CANT_UP-
DATE_GEN_COL
"INSERT UPDATE and
UPSERT are disallowed
on the generated eld"
3070791 - INSERT, UPDATE and UPSERT are
disallowed on the generated eld
410 ERR_SQL_INV_PRIVILEGE_NAME-
SPACE
invalid privilege name-
space
2428863 - Unable to view any package in-
side Content Folder of HANA Studio
411 ERR_SQL_INV_TABLE_TYPE invalid table type
2280915 - CREATE procedure gives error
"258 - insucient privilege: Not authorized er-
ror".
412 ERR_SQL_INV_PASSWORD_LAY-
OUT
invalid password layout
2895515 - Mismatch password_layout error
occurred in HANA.
24 PUBLIC
SAP HANA Troubleshooting and Performance Analysis Guide
Analyzing Generic Symptoms
Code Type Description
More information
414 ERR_SQL_ALTER_PASS-
WORD_NEEDED
user is forced to
change password
Provide a new password for <user> or disable
the password life time if it isn't required (e.g.
because it is a pure technical user):
2399990 - How-To: Analyzing ABAP Short
Dumps in SAP HANA Environments
2137351 - Error: 414 user is forced to
change password for SAPDBCTRL (or SAPHA-
NADBSHD)
2386570 - SAP DBTech JDBC: [591]: internal
error: internal error: user is forced to change
password
2136604 - Error Installing PO on a SAP
HANA Multi-tenant Database
415 ERR_SQL_USER_DEACTIVATED user is deactivated
2574644 - SAP HANA database user is deac-
tivated
2452650 - User password expired with max-
imum_unused_initial_password_lifetime set at
shot time
2681997 - You have reached maximum num-
ber of invalid password entry attempts. User is
locked until ...
3066561
- Parameter detailed_er-
ror_on_connect controls what messages are re-
turned during error connect attempt
416 ERR_SQL_USER_LOCKED user is locked; try
again later
This error is typically caused because the max-
imum number of invalid connect attempts has
been reached. It is controlled by the following
SAP HANA parameter:
indexserver.ini -> [password policy] -> maxi-
mum_invalid_connect_attempts (default: 6)
2399990 - How-To: Analyzing ABAP Short
Dumps in SAP HANA Environments
420 ERR_SQL_ALTER_PASS-
WORD_NOT_ALLOWED
password change cur-
rently not allowed
2765239 - Password change currently not
allowed: minimal password lifetime is x days.
423 ERR_SQL_LVC AFL error
Multiple causes, review KBA 2399990 - How-
To: Analyzing ABAP Short Dumps in SAP HANA
Environments
424 ERR_SQL_INV_PACKAGE invalid name of pack-
age
1891017 - Grant Repository Access to Root
Package in SAP HANA Studio
SAP HANA Troubleshooting and Performance Analysis Guide
Analyzing Generic Symptoms
PUBLIC 25
Code Type Description
More information
430 ERR_SQL_INV_USABLE_PROC invalidated procedure
2935599 - SQL error 430 (invalidated proce-
dure)
2196359 - Limitations for cross-database ac-
cess in an SAP HANA MDC environment
431 WRN_SQL_NEARLY_EX-
PIRED_PASSWORD
user's password will
expire within few days
1752349 - DB connection fails with SQL error
431 - user's password will expire within few days
1702224 - Disable password lifetime for
technical users
435 ERR_SQL_INV_EXP invalid expression
2222219 - SAP HANA Errors and dierent
Results due to Design Changes
2044468 - FAQ: SAP HANA Partitioning
436 ERR_SQL_SET_SYSTEM_LICENSE could not set system li-
cense
2263579 - "could not set system license:
5503: nameserver failed to process the request"
error during HANA license key installation
2311999 - Permanent license import failed
via HDBSQL
2772760 - Unable to apply the permanent
license to SYSTEMDB
437 ERR_SQL_ONLY_LICENSE_HAN-
DLING
only commands for li-
cense handling are al-
lowed in current state
2728984 - System Has No Valid License. Ex-
ecute failed (437) - Instance is registered with
permanent license
2781578 - "License Expired" error when ena-
bling HDI container in MDC HANA environments
2670267 - Error: Get server node failed on
connection 0: rc=437
440 ERR_SQL_TABLE_TYPE_CONVER-
SION_ERROR
table type conversion
error
2397189 - SAP DBTech JDBC: [440]: Table
Type Conversion Error During SUM Upgrade in
The Phase MAIN_SHDIMP/PARMVNT_SHD
442 ERR_SQL_MAX_NUM_COLUMN number of columns ex-
ceeds its maximum
2154870 - How-To: Understanding and den-
ing SAP HANA Limitations
444 ERR_SQL_PACKMAN package manager er-
ror
2936298 - SAP HANA External Machine
Learning Library 2.0 requires libssl 1.0.x
446 ERR_SQL_EXST_TRIGGER cannot use duplicate
trigger name
2911708 - ERROR [SQL-301] unique con-
straint violated: Table(STATISTICS_PROPER-
TIES)
26 PUBLIC
SAP HANA Troubleshooting and Performance Analysis Guide
Analyzing Generic Symptoms
Code Type Description
More information
447 ERR_SQL_BACKUP_FAILED backup could not be
completed
backup could not be completed:' is a preamble
to the actual root cause for the error. Please
check the HANA service trace les for more in-
formation on the error.
Example scenarios:
2472144 - HANA Backup Using Backint fails
with the error: [447] backup could not be com-
pleted, [110203] Not all data could be written
2500531 - Error "ERROR BACKUP SAVE
DATA terminated with error: [447] backup could
not be completed, [2000004 ] Can not open
le" when doing a backup
2399786
- Backup could not be completed:
Error calling io_setup
2623425 - Backup could not be completed
2310262 - Error [110026] - Backup could not
be completed on HANA
2723171
- [447] backup could not be com-
pleted, [3000116 ] Could not acquire save-
point lock
448 ERR_SQL_RECOVERY_FAILED recovery could not be
completed
recovery could not be completed:' is a preamble
to the actual root cause for the error. Please
check the HANA service trace les for more in-
formation on the error.
Example scenarios:
2728068 - HANA Point in time recovery fails
- [448] recovery could not be completed
2688972 - Recovery Error: [448] recovery
could not be completed, [110021] Object 0 with
the value 1024 does not exist - SAP HANA
449 ERR_SQL_RECOVERY_STRATEGY recovery strategy
could not be deter-
mined
recovery strategy could not be determined: ' is a
preamble to the actual root cause for the error.
Please check the HANA service trace les for
more information on the error.
Example scenarios:
2123153 - [449] recovery strategy could not
be determined [110512] Backint during HANA
Recovery
2610577 - Backup destination header is cor-
rupt [110063]
2736164 - recovery strategy could not be de-
termined - BKI1214E: TSM Error for session to
server
SAP HANA Troubleshooting and Performance Analysis Guide
Analyzing Generic Symptoms
PUBLIC 27
Code Type Description
More information
451 ERR_SQL_NOT_AL-
LOWED_SUBJ_TAB_AC-
CESS_TRIGGER
modication of subject
table in trigger not al-
lowed
2800020 - FAQ: SAP HANA Triggers
2222219 - SAP HANA Errors and dierent
Results due to Design Changes
2170927 - Create trigger fails with error
JDBC: [451]: modication of subject table in
trigger not allowed: maximum nesting depth
452 ERR_SQL_INV_BACKUPID invalid backup id
2962261 - Backup catalog housekeeping: in-
valid backup id 'xxxxxxxxxxx'
454 WRN_SQL_WRONG_HINT_SYN-
TAX
wrong hint syntax
2939423 - Getting Error while creating View
with HINT - incorrect syntax near "HINT"
455 ERR_SQL_READ_ONLY_SES-
SION_VARIABLE
the predened session
variable cannot be set
via SET command
2470084 - XSUAA metadata for XS_APPLI-
CATIONUSER trust creation
459 ERR_SQL_INV_USABLE_FUNC invalidated function
This termination indicates that a SAP HANA
function was accessed that is invalidated.
You can use SQL: "HANA_Objects_Functions"
(ONLY_INVALID_FUNCTIONS = 'X') available via
SAP Note 1969700 to list invalid functions in
the system.
2399990 - How-To: Analyzing ABAP Short
Dumps in SAP HANA Environments
461 ERR_SQL_FK_NOT_FOUND foreign key constraint
violation
This error indicates that a change failed due to a
foreign key constraint violation.
2160391 - FAQ: SAP HANA Indexes
2399990 - How-To: Analyzing ABAP Short
Dumps in SAP HANA Environments
462 ERR_SQL_FK_ON_UPDATE_DE-
LETE_FAILED
failed on update or de-
lete by foreign key con-
straint violation
This error indicates that a change failed due to a
foreign key constraint violation.
2160391 - FAQ: SAP HANA Indexes
2399990 - How-To: Analyzing ABAP Short
Dumps in SAP HANA Environments
463 ERR_SQL_MAX_NUM_TABLE number of tables ex-
ceeds its maximum
2154870 - How-To: Understanding and den-
ing SAP HANA Limitations
2968736 - HANA SQL Error 463 - number of
tables exceeds its maximum
28 PUBLIC
SAP HANA Troubleshooting and Performance Analysis Guide
Analyzing Generic Symptoms
Code Type Description
More information
464 ERR_SQL_MAX_PARSE_TREE_DEP
TH
SQL internal parse tree
depth exceeds its max-
imum
2385634 - TREX_EXT_SEARCH_CELL_TA-
BLE Leads to SQL Error "parse tree depth ex-
ceeds its maximum:255"
2332054 - TREX_EXT_LIST_INDEXES fails
with "SQL internal parse tree depth exceeds its
maximum: parse tree depth exceeds its maxi-
mum:255"
465 ERR_SQL_INV_USABLE_TRIGGER "Cannot execute trig-
ger was invalidated by
object change"
This error is caused by an invalidated trigger
(SAP Note 2800020 ) on the underlying ta-
ble.
2800020 - FAQ: SAP HANA Triggers
2399990 - How-To: Analyzing ABAP Short
Dumps in SAP HANA Environments
468 ERR_SQL_HINT hint error
Generic preamble to a more detailed error.
2142945 - FAQ: SAP HANA Hints
2400006 - FAQ: SAP HANA Statement Hints
2938007 - Query on SAP HANA fails with
error 468: hint error
2916954
- Normalization of Whitespaces and
Comments of SQL statements in Statement
Hints
2570351 - Error 468/ "hint error: invalid
hint" From TREX_EXT_SEARCH_CELL_TABLE
or TREX_EXT_AGGREGATE
472 ERR_SQL_EXST_DATA_SOURCE cannot use duplicate
data source name
2408262 - SAP DBTech JDBC: [472]: cannot
use duplicate data source name: __esstore$
474 ERR_SQL_INV_ADAPTER invalid adapter name
2552938 - Error when altering HANA Re-
mote Source connection adapter type from SDA
to SDI: invalid adapter name - SAP HANA 1.0
smart data integration
2440935 - SAP DBTech JDBC: [474] (at 21):
invalid adapter name: mii: line 1 col 22 (at pos
21)
SAP HANA Troubleshooting and Performance Analysis Guide
Analyzing Generic Symptoms
PUBLIC 29
Code Type Description
More information
476 ERR_SQL_INV_REMOTE_OBJECT invalid remote object
name
Preamble to a more detailed error:
2262782 - Unable to export or import SAP
HANA virtual tables
2033611 - Limitation of export / import for
virtual tables
2775477 - SAP DBTech JDBC: [476]: invalid
remote object name: IMPORT_TABLE can't be
used for functions.
2607873
- Error when creating le adapter
virtual table using SQL - SAP HANA Smart Data
Integration
2554385
- ODBC Error during Import of a
HANA Schema / Table(s)
478 ERR_SQL_UDF_RUNTIME user dened function
runtime error
2945199 - search table error: [6859] Attribu-
teEngine: divide by zero
2401963 - Invalid table name exception
when calling UDF
2792149 - currency/unit conversion error:
conversion type '<conversion type>' has unsup-
ported 'BKUZU' or 'GKUZU' type set
485 ERR_SQL_INV_STRUC-
TURED_PRIVILEGE_DEFINITION
invalid denition of
structured privilege
2250455 - SAP DBTech JDBC 485 - Invalid
denition of structured privilege: Invalid lter
condition
2762943 - ERROR [SQL-485] invalid deni-
tion of structured privilege: Condition 1 = 1 can-
not be used for <viewname>
2608634 - Invalid denition of structured
privilege when use HANA external view for
modied composite provider
2563281 - Error message "invalid denition
of structured privilege: Complex condition [...]
cannot be used for view [...]"
488 ERR_SQL_INV_DATABASE invalid database name
HANA Tenant or SYSTEMDB System ID (SID)
not recognised
494 ERR_SQL_INV_EPMQUERY-
SOURCE_DEF
invalid EPM Query
Source denition
2481228 - dberror(PreparedStatement.exe-
cuteUpdate): 494 - invalid EPM Query Source
denition: no valid EPM license available error in
SAP Analytics Cloud (BOC)
30 PUBLIC
SAP HANA Troubleshooting and Performance Analysis Guide
Analyzing Generic Symptoms
Code Type Description
More information
500 ERR_SQL_REQUIRE_PREDICATE predicates are required
in a where clause
2748386 - Error "SAP DBTech JDBC: [500]:
predicates are required in a where clause" When
Running Select * From User Authorization Views
2795522 - Querying EFFEC-
TIVE_ROLE_GRANTEES fails with error un-
known role_name
2088971 - How-To: Controlling the Amount
of Records in SAP HANA Monitoring Views
2564718
- Authorization replication termi-
nates with SQL error message "predicates
are required in a where clause: unknown
user_name"
2541080
- Predicates are required in a where
clause in SAP Analytics Cloud (BOC)
503 ERR_SQL_EXST_TASK cannot use duplicate
name of task
2695441 - Unable to activate ow graph
within the import package - SAP HANA Smart
Data Integration
512 ERR_REP replication error
Generic preamble to a more detailed error:
2852687 - HANA REPLICATION ERROR
2754755 - HANA system replication error oc-
curred
2712064 - SAP HANA System Replication Er-
ror port 4#### already in use
2680982
- Error "site to unregister is still
online, cannot proceed" When Unregistering the
Secondary System in System Replication Envi-
ronment
2813089
- Replication mode/status is UN-
KNOWN in MDC scenario
2695510 - With Table Replication, Error Mes-
sage Flooding in Worker Node Indexserver After
Coordinator Node Failed-over
2796783
- Copying/Moving a Tenant Data-
base From a System Replication Primary Sys-
tem to Another HANA System Fails When Se-
cure Network Communication is Disabled
1999880 - FAQ: SAP HANA System Replica-
tion
513 ERR_SQL_REP_ALREADY_ACTIVE cannot execute DDL
statement on replica-
tion table while repli-
cating
DDL like CREATE/ALTER/DROP etc not possi-
ble during replication operation
SAP HANA Troubleshooting and Performance Analysis Guide
Analyzing Generic Symptoms
PUBLIC 31
Code Type Description
More information
544 ERR_RS_PARTITION partition error
2930379 - How to increase the total number
of partitions for CDPOS table
576 ERR_API api error
2618451 - SSL API error happened when
copy or move tenant database between HANA
systems
2650994 - SAP HANA System Replication
does not work with DB isolation set to HIGH
2771017 - Replication does not complete due
to nameserver error
2561693
- HANA Database fails to start due
to SSL error
2862268 - BI Commentary Guidelines for
HANA SSL Connections
578 ERR_API_INV_STATEMENT invalid statement
The issue can be a consequence of problems on
lower layers (infrastructure / hardware) result-
ing in a malformed statement ID.
2399990 - How-To: Analyzing ABAP Short
Dumps in SAP HANA Environments
589 ERR_API_TOO_MANY_PARAME-
TERS
too many parameters
are set
3040627 - Error 589 - too many parameters
are set: number of parameters xxxxx exceeds
maximum number of parameters, 32767
2154870 - How-To: Understanding and den-
ing SAP HANA Limitations
2380176 - FAQ: SAP HANA Database Trace
592 ERR_API_NOT_SUP-
PORTED_TYPECONV
not supported type
conversion
2962294 - HANA Alert 27 is disabled and will
not be called. Reason: timeout SNAPSHOT_ID:
<timestamp>
2380176 - FAQ: SAP HANA Database Trace
597 ERR_API_SESSION_CONTEXT_ER-
ROR
session context error
Preamble to more detailed error described fur-
ther in:
2380176 - FAQ: SAP HANA Database Trace
2399990 - How-To: Analyzing ABAP Short
Dumps in SAP HANA Environments
32 PUBLIC
SAP HANA Troubleshooting and Performance Analysis Guide
Analyzing Generic Symptoms
Code Type Description
More information
598 ERR_API_EXTERNAL_EXECU-
TION_FAILURE
Failed to execute the
external statement
This is a common preamble to a more detailed
error. It can have multiple causes.
Please review the error detail from the index-
server traces and search the SAP HANA Knowl-
edge base for existing Knowledge based articles
and SAP Notes.
2776953 -Query Fails With Error "failed to
execute the external statement: no such data
type:.." in HANA Scale-out System
600 ERR_API_CALL_ROUTING_FAIL-
URE
failed routed execution
Preamble to more detailed error described fur-
ther in:
2380176 - FAQ: SAP HANA Database Trace
2200772 - FAQ: SAP HANA Statement Rout-
ing and Client Distribution Mode
2399990 - How-To: Analyzing ABAP Short
Dumps in SAP HANA Environments
2090424
- Error -10108 (Session has
been reconnected) after failover of coordina-
tor/worker node
2591281
- Blocked Transactions from HANA
JDBC Client Call - Session Will be Closed due to
the Error: [600] failed routed execution
2691896 - Distributed Query Fails With
"StatementRouting Connection.cc(xxxxx): failed
to join XA session due to active user transac-
tion"
603 ERR_API_INV_LOB invalid LOB
2116157 - FAQ: SAP HANA Consistency
Checks and Corruptions
2690991 - Error 5400 Invalid type 64 in
column of type 32 at udiv during consistency
check
2408032 - Reading From LOB Binary Stream
After Closing the ResultSet via JDBC Fails With
Error "invalid lob locator id (piecewise lob read-
ing)"
3017449 - Indexserver Crash in TRexCom-
monObjects::writeRow When Executing an UP-
DATE Statement on a Partitioned Table
606 ERR_API_EXCEED_MAX_LOB_SIZE exceed maximum LOB
size
See 2154870 - How-To: Understanding and
dening SAP HANA Limitations
SAP HANA Troubleshooting and Performance Analysis Guide
Analyzing Generic Symptoms
PUBLIC 33
Code Type Description
More information
608 ERR_API_EXCEED_MAX_PRE-
PARED_STATEMENT
exceed maximum
number of prepared
statements
System limitation. Described further in:
3031816 - "ERROR [SQL-608] exceed maxi-
mum number of prepared statements" and "the
number of prepared statements per connection
cannot exceed <number>"
2154870 - How-To: Understanding and den-
ing SAP HANA Limitations
2399990 - How-To: Analyzing ABAP Short
Dumps in SAP HANA Environments
2380176 - FAQ: SAP HANA Database Trace
613 ERR_API_TIMEOUT execution aborted by
timeout
This error indicates that a database request hit
the timeout (in seconds)
2000003 - FAQ: SAP HANA
2399990 - How-To: Analyzing ABAP Short
Dumps in SAP HANA Environments
3116306 - [Error] execution aborted by time-
out while partitioning
640 ERR_SQL_2 sql processing error
Starting with SAP HANA Rev. 122.03 the
THROW_ERROR hint is available (SAP Note
2436893 ) that terminates the execution of
the underlying database request
2380176 FAQ: SAP HANA Database Trace
2073630 - DBIF_RSQL_SQL_ERROR SQL er-
ror 256 when access table
2142945
FAQ: SAP HANA Hints
648 ERR_SQL_TRIG-
GER_AND_PROC_NEST-
ING_DEPTH_EXCEEDED
nesting depth of trig-
ger and procedure is
exceeded
System limitation:
2134323 - Nesting error in
SQLRUN_ISU_TRIGGERS: maximum depth 8
2977828 - Trigger Creation Fails With 'nest-
ing depth of trigger and procedure is exceeded'
2130431 - 'Nesting depth of trigger and pro-
cedure is exceeded' error is raised when SQL
trigger with procedure call is created
651 ERR_SQL_EXST_OBJECT cannot use duplicate
object name
2572224 - How-To: Repairing SAP HANA Ta-
bles
663 ERR_SQL_CONNECT_NOT_AL-
LOWED
user not allowed to
connect from client
3171342 - ERROR [SQL-663] user not al-
lowed to connect from client
34 PUBLIC
SAP HANA Troubleshooting and Performance Analysis Guide
Analyzing Generic Symptoms
Code Type Description
More information
684 ERR_SQL_PLANSTABIL-
IZER_STORED_HINT_RECORD_AL-
READY_EXISTS
plan stabilizer stored
hint error - statement
hint record already ex-
ists
2700051 - Delivery of Statement Hints (SAP
HANA >= 1.00.122.03)
2400006 - FAQ: SAP HANA Statement Hints
685 ERR_SQL_PLANSTABIL-
IZER_STORED_HINT_RE-
CORD_DOES_NOT_EXIST
plan stabilizer stored
hint error - statement
hint record does not
exist
2700051 - Delivery of Statement Hints (SAP
HANA >= 1.00.122.03)
2400006 - FAQ: SAP HANA Statement Hints
1024 ERR_SES session error
Preamble to more detailed error:
2303494 - Importing Delivery Unit fails with
"Session error: Repository: Activation failed for
at least one object"
2280915 - CREATE procedure gives error
"258 - insucient privilege: Not authorized er-
ror".
2775970 - The re-import of a delivery unit
fails after an upgrade
1025 ERR_COM communication error
Network or communication related problem
2222200 - FAQ: SAP HANA Network
2399990 - How-To: Analyzing ABAP Short
Dumps in SAP HANA Environments
2000003 - FAQ: SAP HANA
1026 ERR_COM_LISTEN cannot bind a commu-
nication port
2261671 - "cannot bind to the local port"
when start HANA services
1033 ERR_SES_INV_PROTOCOL error while parsing
protocol
These terminations indicate a severe prob-
lem during parsing the communication pro-
tocol. Check the database trace (SAP Note
2380176 ) for more details. Typically you will
nd an error "failed to encode cursor: error
while parsing protocol" with further accompany-
ing details.
2380176 - FAQ: SAP HANA Database Trace
2399990 - How-To: Analyzing ABAP Short
Dumps in SAP HANA Environments
1037 ERR_COM_UNKNOWN_HOST unknown hostname
2941074 - SAP HANA server rebooted
2936450 - SAP HANA is down without crash
or shutdown
SAP HANA Troubleshooting and Performance Analysis Guide
Analyzing Generic Symptoms
PUBLIC 35
Code Type Description
More information
1038 ERR_SES_SERVER_BUSY rejected as server
is temporarily over-
loaded
2908549 - SAP HANA Database requests fail
with error code 1038
2399990 - How-To: Analyzing ABAP Short
Dumps in SAP HANA Environments
2222250 - FAQ: SAP HANA Workload Man-
agement
3061965
- Unexpected Error "rejected as
server is temporarily overloaded"
1335 ERR_SQLSCRIPT_RUNTIME_CY-
CLIC_DEPENDENCY
Cyclic dependency
found in a runtime pro-
cedure
3032114 - Cyclic Dependency Error When
Revoking Role From User Through GRC in
SPS05
3018242 - Removing Role From User via
HANA or GRC Can Cause Cyclic Dependency
Error
1793 ERR_SHM_CREATE_INVALID invalid key or invalid
size
This issue can arise due to wrong conguration
of shared memory setting on OS level.
2827664 - NameServer persistence initiali-
zation failed
2048 ERR_CS Column store error
Generic preamble to a more detailed error de-
scription:
2399990 - How-To: Analyzing ABAP Short
Dumps in SAP HANA Environments
1999997 - FAQ: SAP HANA Memory
2222200 - FAQ: SAP HANA Network
2044468
- FAQ: SAP HANA Partitioning
2380176 - FAQ: SAP HANA Database Trace
2054 ERR_CS_DELTA_LOG_RE-
PLAY_FAILED
Redo log replay failed
Check HANA service traces for more detail on
the error cause
2055 ERR_CS_MAXIMUM_ROW Maximum number of
rows per table or parti-
tion reached
System limitation:
2212518 - HANA error maximum number of
rows per partition reached
2154870 - How-To: Understanding and den-
ing SAP HANA Limitations
2964715 - Maximum number of rows per
table or partition reached: '_SYS_AUDIT:CS_AU-
DIT_LOG_'
2399990
- How-To: Analyzing ABAP Short
Dumps in SAP HANA Environments
36 PUBLIC
SAP HANA Troubleshooting and Performance Analysis Guide
Analyzing Generic Symptoms
Code Type Description
More information
2560 ERR_METADATA Metadata error
Preamble to more detailed error:
2399990 - How-To: Analyzing ABAP Short
Dumps in SAP HANA Environments
2380176 - FAQ: SAP HANA Database Trace
2116157 - FAQ: SAP HANA Consistency
Checks and Corruptions
2561 ERR_DIST_METADATA Distributed metadata
error
2116157 - FAQ: SAP HANA Consistency
Checks and Corruptions
2245772 - distributed metadata error: Failed
to get table location during table lock - Error
during BW upgrade or migration
2566 ERR_DIST_META-
DATA_TNSCLIENT_FAILURE
Distributed environ-
ment error
2116157 - FAQ: SAP HANA Consistency
Checks and Corruptions
2240241 - Failed to update dependency: dis-
tributed environment error
2447887 - Removing Multiple Services from
HANA Scale Out Environment Can Lead to Data
Loss
2062308
- Deadlock Between Worker and
Coordinator Node During Worker Startup
2433918 - Execution of a Stored Procedure
Fails With the Message "distributed environ-
ment error: table already exists;newIndex(..):
catalog creation failed"
2567 ERR_DIST_METADATA_NET-
WORK_FAILURE
Network error
Generic preamble to a more detailed descrip-
tion:
2399990 - How-To: Analyzing ABAP Short
Dumps in SAP HANA Environments
1999880 - FAQ: SAP HANA System Replica-
tion
2057046 - FAQ: SAP HANA Delta Merges
2116157
- FAQ: SAP HANA Consistency
Checks and Corruptions
SAP HANA Troubleshooting and Performance Analysis Guide
Analyzing Generic Symptoms
PUBLIC 37
Code Type Description
More information
3584 ERR_DIST_SQL Distributed SQL error
Generic preamble to a more detailed descrip-
tion:
1999997 - FAQ: SAP HANA Memory
1999998 - FAQ: SAP HANA Lock Analysis
2116157 - FAQ: SAP HANA Consistency
Checks and Corruptions
2380176
- FAQ: SAP HANA Database Trace
2901387 - Unable to run HANA_Congura-
tion_MiniChecks_2.00.040+
3105683 - A Query Fails With an Error "dis-
tributed SQL error: [18] A received argument
has an invalid value"
3121246
- SQL error "SAP DBTech JDBC:
[3584]: distributed SQL error: [18] A received
argument has an invalid value"
1969700 - SQL Statement Collection for SAP
HANA
3587 ERR_DIST_SQL_INVALID_PROTO-
COL
Invalid protocol or
service shutdown dur-
ing distributed query
execution
The following error messages can indicate OOM
situations. Be aware that some of the errors can
also be issued in other scenarios. To make sure
that they are really memory related, you have to
check the related trace le.
1999997
- FAQ: SAP HANA Memory
3589 ERR_DIST_SQL_REMOTE_EXECU-
TION_FAILURE
Remote query execu-
tion failure
2439128 - Error 3589 - "remote query execu-
tion failure" When Opening XS Applications
3841 ERR_AUDITING_NO_PRIV_NAME Invalid privilege
2428863 - Unable to view any package in-
side Content Folder of HANA Studio
3843 ERR_AUDITING_POLICY_AL-
READY_EXISTS
Audit policy with cur-
rent name already ex-
ists
Policy name already created as per "CREATE
AUDIT POLICY ... "
3844 ERR_AUDITING_INV_POL-
ICY_TYPE
Invalid combination of
audit actions
Check auditing conguration and setup:
Auditing Activity in SAP HANA
Audit Policies
Audit Trails
Auditing Conguration and Audit Policy Man-
agement
Best Practices and Recommendations for Cre-
ating Audit Policies
Conguring Database Auditing
38 PUBLIC
SAP HANA Troubleshooting and Performance Analysis Guide
Analyzing Generic Symptoms

Code Type Description
More information
3846 ERR_AUDITING_INV_LEVEL Invalid auditing level
Check auditing conguration and setup:
Auditing Activity in SAP HANA
Audit Policies
Audit Trails
Auditing Conguration and Audit Policy Man-
agement
Best Practices and Recommendations for Cre-
ating Audit Policies
Conguring Database Auditing
3847 ERR_AUDITING_INV_POL-
ICY_NAME
Invalid policy name
Check auditing conguration and setup:
Auditing Activity in SAP HANA
Audit Policies
Audit Trails
Auditing Conguration and Audit Policy Man-
agement
Best Practices and Recommendations for Cre-
ating Audit Policies
Conguring Database Auditing
3848 ERR_AUDITING_INV_ACTION_OB-
JECT_TYPE
Invalid combination of
audit action and object
type
Check auditing conguration and setup:
Auditing Activity in SAP HANA
Audit Policies
Audit Trails
Auditing Conguration and Audit Policy Man-
agement
Best Practices and Recommendations for Cre-
ating Audit Policies
Conguring Database Auditing
3849 ERR_AUDITING_INV_OB-
JECT_TYPE
Audit policy for this
object type not sup-
ported
Check auditing conguration and setup:
Auditing Activity in SAP HANA
Audit Policies
Audit Trails
Auditing Conguration and Audit Policy Man-
agement
Best Practices and Recommendations for Cre-
ating Audit Policies
Conguring Database Auditing
SAP HANA Troubleshooting and Performance Analysis Guide
Analyzing Generic Symptoms
PUBLIC 39
Code Type Description
More information
4096 ERR_PLANVIZ_GENERAL [PlanViz] general error
2275905 - How to disallow the Usage of
PlanViz in a SAP HANA System
2825090 - PlanViz for a DML Statement on
Row Store Table Fails in Scale-Out System
2337716 - SAP DBTech JDBC: [4096]: [Plan-
Viz] general error: Not supported yet; Please
update your server instance
4098 ERR_PLANVIZ_INVA-
LID_PLAN_GENERAL
[PlanViz] invalid plan
2781336 - PlanViz Execution Fails With "inva-
lid plan -- try preparing statement again"
4104 ERR_PLANVIZ_PLAN_NOT_FOUND [PlanViz] plan not
found
2337716 - SAP DBTech JDBC: [4096]: [Plan-
Viz] general error: Not supported yet; Please
update your server instance
4105 ERR_PLANVIZ_UNSUP-
PORTED_STMT_TYPE
[PlanViz] unsupported
statement type
2822978 - Statement Execution Fails In SAP
HANA Studio after PlanViz Generation Failed
4109 ERR_PLAN-
VIZ_TRACE_ONLY_GENERAL
[PlanViz] error in
trace-only mode
Due to a SAP HANA bug this error can happen
when plan trace is activated with a statement
hash lter on SAP HANA <= 2.00.046. Make
sure that the plan trace is only activated when
really required and optimally in non-production
systems.
2399990 - How-To: Analyzing ABAP Short
Dumps in SAP HANA Environments
2781336 - PlanViz Execution Fails With "inva-
lid plan -- try preparing statement again"
4249 ERR_USER_PARAM_DUPLI-
CATE_EMAIL_ADDRESS
Same email address
cannot be used for dif-
ferent users
2845742 - SAP HANA Cockpit user deletion
after failed logon attempts with wrong password
4251 ERR_USER_PARAM_INVA-
LID_STATEMENT_MEMORY_LIMIT
Invalid statement
memory limit
Setting User Parameters for Workload
2222250 - FAQ: SAP HANA Workload Man-
agement
4252 ERR_USER_PARAM_INVA-
LID_STATEMENT_THREAD_LIMIT
Invalid statement
thread limit
Setting User Parameters for Workload
2222250 - FAQ: SAP HANA Workload Man-
agement
40 PUBLIC
SAP HANA Troubleshooting and Performance Analysis Guide
Analyzing Generic Symptoms
Code Type Description
More information
4274 ERR_KERBEROS_DUPLI-
CATE_PROVIDER
Duplicate specication
of identity for KER-
BEROS
2921965 - Duplicate specication of identity
for KERBEROS
4280 ERR_TICKET General ticket error
2872841 - Cannot Load Tile Error on Fiori
Launchpad
4321 ERR_SSL_ENFORCE Only secure connec-
tions are allowed
Preamble to more detailed error:
2999904 - hdbsql failed with error "4321:
only secure connections are allowed SQLSTATE:
HY000".
2475246 - How to congure HANA DB con-
nections using SSL from ABAP instance
2572975 - Solman monitoring of only spe-
cic HANA DBs using SSL
3168368
- After setting sslenforce as true in
HANA database, the R3trans, transport in ABAP
are failing
2818623
- Enabled SSL DBCO connection
SolMan to HANA result in sql error 4321
3028338 - "Only secure connections are al-
lowed" in HDB_CHK_PRIVILEGES phase with
SUM 1.0
2420711
- FAQ: SAP HANA XimoStudio
2795610 - Enabling SSO in HANA Cockpit
Manager of SAP HANA Cockpit 2 Fails When
sslEnforce=true on the Remote SAP HANA Sys-
tem
3083365 - User Provided Service connec-
tions with SSL functionality is not available in
SAP HANA Web IDE for HANA ( On-Premise)
5136 ERR_TEXT_COMMON_ALLOCA-
TION_FAILED
Allocation failed.
Memory allocation failure. Preamble to more de-
tailed error:
See '1. Which indications exist for SAP HANA
memory problems?' - 1999997 - FAQ: SAP
HANA Memory
SAP HANA Troubleshooting and Performance Analysis Guide
Analyzing Generic Symptoms
PUBLIC 41
Code Type Description
More information
5170 ERR_TEXT_COM-
MON_FILE_NOT_FOUND
File not found.
This a generic error where an expected system,
library (dll) le or third party client driver le
cannot be found at the expected or congured
directory location.
Some example scenarios:
2349144 - HANA instance does not stop –
kill.sap le not found
2981347 - Failed to create an SDA connec-
tion between HANA and DB2 - Can't open lib
'/opt/IBM/db2/dsdriver/lib/libdb2o.so.1': le
not found
2928047 - libsqora.so.11.1': le not found
5172 ERR_TEXT_COMMON_INVA-
LID_LENGTH
Invalid length.
Table column inconsistency.
2905396 - Error 5995 reported by check_ta-
ble_consistency
2116157 - FAQ: SAP HANA Consistency
Checks and Corruptions
5533 ERR_TEXT_PREPROCES-
SOR_FAILED
Preprocessor: failed
This error indicates a problem when communi-
cating with the preprocessor service, e.g. in con-
text of text searches. You can check the prepro-
cessor database trace (SAP Note 2380176 )
for further details.
2399990 - How-To: Analyzing ABAP Short
Dumps in SAP HANA Environments
5634 ERR_CERTADM_INVA-
LID_CERT_DEFINITION
Certicate denition
inconsistent
2975450 - Error: "5634: Certicate denition
inconsistent" when import Trusted Certicate
via SQL
5637 ERR_CERTADM_CERTIFI-
CATE_IN_USE
Certicate could not
be dropped because it
is still in use by at least
one PSE
3169349 - Certicate could not be dropped
because it is still in use by at least one pse
5736 ERR_MASKING_INVALID_COL-
UMN_DATATYPE
Masking: not sup-
ported data type
2669149 - Masking: not supported data
type: exception 4075007 : column col-
umn_name does not have a character string
data type and cannot be masked
42 PUBLIC
SAP HANA Troubleshooting and Performance Analysis Guide
Analyzing Generic Symptoms
2.3 Performance and High Resource Utilization
By observing the general symptoms shown by the system such as poor performance, high memory usage,
paging or column store unloads we can start to narrow down the possible causes as a rst step in analyzing the
issue.
High Memory Consumption
You observe that the amount of memory allocated by the SAP HANA database is higher than expected. The
following alerts indicate issues with high memory usage:
• Memory usage of name server (Alert 12)
• Total memory usage of Column Store tables (Alert 40)
• Memory usage of services (Alert 43)
• Memory usage of main storage of Column Store tables (Alert 45)
• Runtime dump les (Alert 46)
See the section Memory Problems for information on analyzing the root cause.
Out-of-Memory Situations
You observe trace les or error messages indicating an Out-of-Memory (OOM) situation.
See the section Memory Problems for information on analyzing the root cause.
Paging on Operating System Level
You observe that paging is reported on operating system level.
See the section Memory Problems for information on analyzing the root cause.
Column Store Unloads
You observe unloads in the column store. The following alerts indicate issues with high memory usage:
• Column store unloads (Alert 55)
See the section Memory Problems for information on analyzing the root cause.
SAP HANA Troubleshooting and Performance Analysis Guide
Analyzing Generic Symptoms
PUBLIC 43

Permanently Slow System
Issues with overall system performance can be caused by a number of very dierent root causes. Typical
reasons for a slow system are resource shortages of CPU, memory, disk I/O and, for distributed systems,
network performance.
Check Overview Monitoring and Administration Performance Monitor for either Memory, CPU or Disk
Usage. If you see a constant high usage of memory or CPU, proceed with the linked sections Memory Problems
or CPU Related Root Causes and Solutions respectively. I/O Related Root Causes and Solutions provides ways
to check for disk I/O related problems. In case of network performance issues, have a look at the Monitor
Network page accessible from the Monitoring group in the SAP HANA cockpit.
Note that operating system tools can also provide valuable information on disk I/O load. Basic network I/O
data is included in the Load graph and in the M_SERVICE_NETWORK_IO system view, but standard network
analysis tools can also be helpful to determine whether the network is the main bottleneck. If performance
issues only appear sporadically, the problem may be related to other tasks running on the database at the
same time.
These include not only maintenance related tasks such as savepoints (disk I/O, see I/O Related Root Causes
and Solutions) or remote replication (network I/O), but also SQL statements dispatched by other users, which
can block a lot of resources. In the case of memory, this can lead to unloads of tables, which aects future SQL
statements, when a table has to be reloaded into memory. In this case, see Memory Problems as well. Another
reason for poor performance, which in many cases cannot be detected by the SAP HANA instance itself, are
other processes running on the same host that are not related to SAP HANA. You can use the operating system
tools to check for such processes. Note that SAP only supports production systems running on validated
hardware.
Slow Individual SQL Statements or with Increasingly Long Runtimes
Issues with the performance of a particular statement can be caused by a number of very dierent root causes.
In principle, a statement can trigger all the resource problems that also lead to an overall slowdown of the
system, so most of the previous information also applies to statement performance. In addition, statement
performance can suer from transactional problems, that is, blocked transactions. Blocked transactions can
be checked in the Threads tile or on the Blocked Transactions page accessible from the Monitoring group. For
troubleshooting, proceed with Transaction Problems.
If the runtime of a statement increases steadily over time, there could be an issue with the delta merge
operation. Alerts should be issued for most problems occurring with the delta merge, but since they depend
on congurable thresholds, this is not always the case. For troubleshooting, proceed with Delta Merge. If you
have none of the above problems, but the statement is still too slow, a detailed Statement Performance Analysis
might reveal ways to optimize the statement. However, some queries are inherently complex and require a lot
of computational resources and time.
Related Information
Memory Problems [page 65]
44
PUBLIC
SAP HANA Troubleshooting and Performance Analysis Guide
Analyzing Generic Symptoms

CPU Related Root Causes and Solutions [page 82]
Disk Related Root Causes and Solutions [page 106]
I/O Related Root Causes and Solutions [page 114]
M_SERVICE_NETWORK_IO
Transactional Problems [page 167]
Delta Merge [page 129]
Statement Performance Analysis [page 180]
2.4 Common Symptoms and Troubleshooting
Typical symptoms and the related troubleshooting information are described in this section.
System-side slow performance, slow individual statement performance, and OOM problems are issues that
you might experience while using the SAP HANA database. For each section, this document will cover the
known symptoms and the corresponding troubleshooting steps to follow depending on the causes.
2.4.1Slow System-wide Performance
Slow system-wide performance issues are problems that could be caused by excessive use of CPU, database
resource locks or incorrect conguration of OS parameters.
Generally, when you encounter a performance issue, you may see these symptoms in SAP HANA cockpit:
• Continually high CPU usage according to OS commands or load graph (visible from CPU Usage tile -
Performance Monitor)
• Many pending or waiting threads in the thread view (details visible from the Threads tile).
To look for the cause at the operating system level refer to the topic System Appears to Hang with High System
CPU Usage.
If the performance issue persists or if it recurs sporadically you may need to contact Support to analyze the
root cause. In this case please generate at least two runtime dumps at 3 minute intervals while the system
performance is slow for further investigation. For details refer to SAP Note 1813020 - How to generate a runtime
dump on SAP HANA or the Guided Answer How to generate a runtime dump.
Related Information
System Appears to Hang with High System CPU Usage [page 54]
SAP Note 1813020
How to generate a runtime dump (Guided Answer)
SAP HANA Troubleshooting and Performance Analysis Guide
Analyzing Generic Symptoms
PUBLIC 45
2.4.1.1 HANA System-wide Performance Analysis
This topic describes solutions for both current and former system performance problems.
Analysis of Current Performance Problems
Before taking any other action while the problem is present it is of utmost importance to capture a few HANA
runtime environment (RTE) dump les and a Kernel Proler Trace to collect information about the database's
internal processes. Proceed as follows:
Generating a Runtime Dump
Capture a number (3-5) of RTE dumps. There are several options for recording runtime dumps as described in
the KBA 1813020 - How to generate a runtime dump on SAP HANA.
If the problem occurs randomly and you cannot predict when it will happen you can automate the collection
of the runtime dumps with the SAP HANASitter tool which can be used, for example, to trigger methods
such as the creation of traces and dumps when specic conditions are met. Refer to KBA 2399979 - How-To:
Conguring automatic SAP HANA Data Collection with SAP HANASitter.
Kernel Proler Trace
Create a Kernel Proler Trace, either:
• via the SQL console (see ALTER SYSTEM START KERNEL PROFILER statement)
• in hdbcons as described in KBA 1804811 SAP HANA Database: Kernel Proler Trace.
Analysis
Once the RTE Dumps are ready use an automated analysis tool such as the HANA Dump Analyzer to spot
obvious problems. Refer to SAP Note 2498739 - How-To: Analyzing Runtime Dumps with SAP HANA Dump
Analyzer. Most known problem situations are recognizable by the tool and you should then be able to take the
rst mitigation steps. Using the 'Auto Analyzer' option in the HANA Dump Analyzer the following summaries
might be shown in the result:
• High Workload
• High CPU
• Waitgraph detected
Each of the identied issues require specic steps to perform an in-depth analysis and gain further insight on
what potential culprits are.
High workload / High CPU
This indicates that most of the active / running threads are in ownership of one specic application workload;
if the HANA instance is congured according to ocial SAP guidance this should not happen under normal
circumstances. It is important to understand which application user is responsible for the workload. If the
situation is disruptive, ask the user to refrain form any further actions until the exact root cause is identied to
avoid worsening the situation.
46
PUBLIC
SAP HANA Troubleshooting and Performance Analysis Guide
Analyzing Generic Symptoms
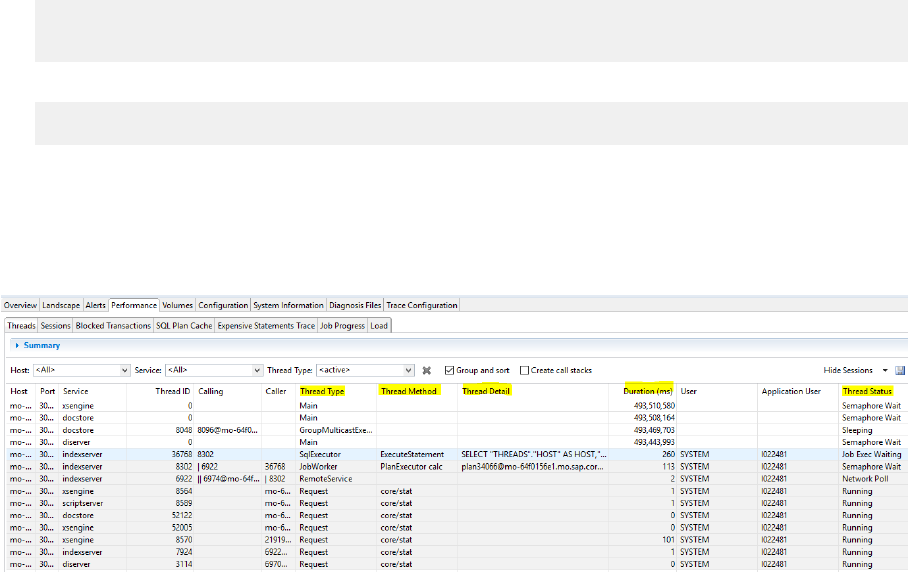
As a second step, check whether HANA Workload Management is congured according to SAP
recommendations. Refer to KBA 2222250 – FAQ: HANA Workload Management. Pay particular attention to
the appropriate conguration of the following workload related parameters:
• default_statement_concurrency_limit
• max_concurrency*
• max_concurrency_hint*
• num_cores*
(*not necessarily required as of HANA SPS3) Refer to KBA 2600030 – Parameter Recommendations in SAP
HANA Environments.
Waitgraph detected
This situation indicates that threads are not able to eciently acquire locks on objects as they are already held
by other threads (see Thread investigation below). The waitgraph is a directed graph depicting which threads
are waiting for which locks and in turn which threads are holding the locks to be acquired. It is a good practice
here to investigate what exactly the lock-holding threads (not the lock acquiring threads) are busy with. If
no insights can be gained during this analysis and the problem requires an immediate mitigation, consider
canceling the session responsible for the lock-holding threads by:
1. Identifying the corresponding connection ID of the problematic thread by examining the runtime dump;
search the le for the thread ID identied, for example:
1348967027[thr=<thread_id>]: SqlExecutor, TID: 34, UTID: 364438059, CID:
<conn_id>,….
2. Cancel the session with:
ALTER SYSTEM CANCEL SESSION ‘<conn_id>’;
Threads
A next step is to check what threads are currently running on the database while the performance issue
exists. You can check this in SAP HANA cockpit from the Threads card of the System Overview or from the
Performance tab in SAP HANA Studio which is illustrated here:
Threads Overview
Refer to KBA 2114710 - FAQ: SAP HANA Threads and Thread Samples for tips on how to identify and
solve problems with running and blocked threads. The information given for the following frequently-asked
questions, for example, will be helpful:
• What kind of information is available for the SAP HANA threads?
SAP HANA Troubleshooting and Performance Analysis Guide
Analyzing Generic Symptoms
PUBLIC 47
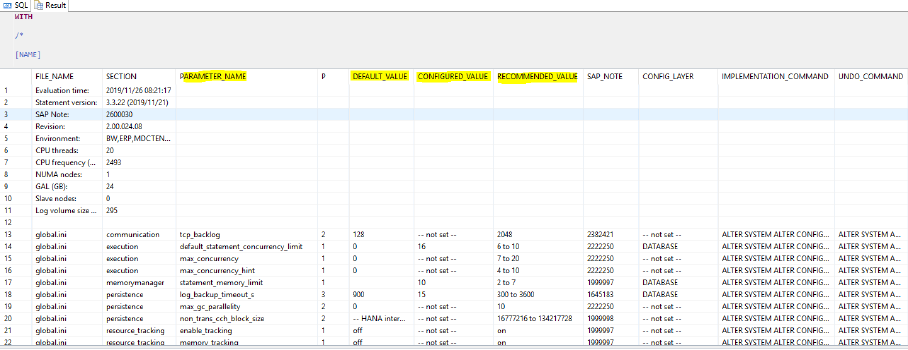
• How can I interpret the thread state?
• What are the main thread types, methods and details?
HANA Database Parameters
Check that the database parameters are congured as recommended. You can do this by running the
script HANA_Conguration_Parameters_1.00.90+, or HANA_Conguration_Parameters_Values_1.00.90+_MDC
attached to the KBA 1969700 SQL Statement Collection for SAP HANA. The script can be executed in the
system database as well as at the tenant database level. Recommended parameter values are discussed in
more detail in the KBA 2600030 Parameter Recommendations in SAP HANA Environments.
Example Output of the HANA_Conguration_Parameters_1.00.90+ Script
Analysis of Former Performance Problems
You can also analyze system-wide performance problems that occurred in the past using the methods
described here.
Thread Sample Analysis
When the issue is no longer present, a HANA Thread Sample analysis can be conducted to identify potential
culprits. Proceed as follows using the scripts in the SQL Statement Collection for SAP HANA (attached to SAP
Note 1969700 - see link in Further Information below):
1. Dene a problematic time-period: be as accurate as possible here to avoid
distortion of the statistical data by workloads not directly related. Use
scripts TimeFrameReport (HANA_Global_TimeFrameReport_2.00.043+.txt) and LoadHistory
(HANA_LoadHistory_Services_2.00.030+.txt) to do the following:
• Evaluate CPU / Memory / Disk
• Check Running vs. Waiting Threads
• Check on MVCC Versions
• Check Blocked Transactions / Locking Issues
2. Use the above information to identify the most active application workload for a dened time-period using
the script HANA_Threads_ThreadSamples_FilterAndAggregation_*.
If you had a high CPU utilization in the past, use the script HANA_LoadHistory_Services_2.00.*.txt (or
HANA_LoadHistory_Services_1.00.120+.txt for HANA 1) to nd a time-period where the CPU was high. If a
problematic time-period is identied run the HANA_Threads_ThreadSamples_FilterAndAggregation_* script
48
PUBLIC
SAP HANA Troubleshooting and Performance Analysis Guide
Analyzing Generic Symptoms
for this specic period. For example, if you have identied the period 10:00-11:00 a.m. on the 25th April, go to
the modication section of the script and enter the following values:
'2021/04/07 10:00:00' BEGIN_TIME,
'2021/04/07 11:00:00' END_TIME,
If the issue lies further in the past (older than few hours), you have to switch the DATA_SOURCE to ‘HISTORY’:
'HISTORY' DATA_SOURCE,
You can use the AGGREGATE_BY lter, for example, to see which threads have been consuming most of the
CPU time:
'HASH, THREAD_STATE, THREAD_DETAIL, THREAD_METHOD' AGGREGATE_BY
Use the AGGREGATE_BY lter with the following values if you want to see which application user and
component was actively consuming most of the CPU time:
'HASH, THREAD_STATE, APP_SOURCE, APP_USER' AGGREGATE_BY
Additionally, if you are only looking for the threads actively consuming CPU, you can set a lter in the
modication section for THREAD_STATE:
'RUNNING' THREAD_STATE,
For further information refer to KBA 2114710 - FAQ: SAP HANA Threads and Thread Samples.
Log Files for OS and Network
If the steps already described do not help to identify the performance problem, then it may be that the issue
is not related to the SAP HANA database but could be an operating system, hardware, or network-related
problem. In this case you can check the messages le for the time of the performance issue from the directory
VAR/LOG for the HANA nodes. Check the messages for any indication of OS, hardware or network-related
problems.
If necessary you can collect a runtime dump when the performance issue happens again and is live on the
system as described above.
Known Performance issues and How to Resolve Them
The following table identies some specic known problems with links to KBAs which give technical details
about how to resolve them.
Symptom
Solution
After migration to HANA DB for ECC
or Suite on HANA systemreports and
transactions are slow.
Check that you are using HANA optimized transactions and applications, some
optimizations may need to be explicitly switched on via the switch framework
(transaction SFW5). Refer to SAP Note 1761546 - SAP ERP powered by SAP HANA
- Optimizations and the attached document (Suite on HANA Optimizations)
which lists optimized objects (reports and transactions).
1761546
SAP ERP powered by SAP HANA - Optimizations
SAP HANA Troubleshooting and Performance Analysis Guide
Analyzing Generic Symptoms
PUBLIC 49
Symptom Solution
After migration to HANA DB custom
transactions or ABAP programs are
slow.
You may need to optimize custom programs and transactions by using the code
inspector tool and SQL monitor. Refer to the note1912445
- ABAP custom
code migration for SAP HANA - recommendations and Code Inspector variants for
SAP HANA migration.
See also the blog post 'ABAP on HANA - from analysis to optimization' which
includes, for example, a section on The Golden Rules: Five performance guidelines
for ABAP database operations.
The system is slow with a lot of state-
ments running. Statements of the type
SELECT TOP X cause a performance
problem on SAP HANA.
Refer to the SAP Note 2238679 - High CPU Consumption Caused by UniedTa-
ble::MVCCObject::generateOLAPBitmapMVCC.
After a HANA upgrade the performance
of calculation views is poor.
Refer to the following SAP Notes:
• 2441054
- High query compilation times and absence of plan cache entries
for queries against calculation views
• 2291812 SAP HANA DB: Disable/Enable CalculationEngine Feature - Calc-
View Unfolding.
In an ABAP environment you are using
the fast data access (FDA) protocol and
the performance of queries is poor.
Refer to the KBA2399993 - FAQ: SAP HANA Fast Data Access. Question 6
identies a list of possible problems which may occur with FDA.
Using fast data access the HANA
system has poor performance. In
the HANA trace les you see en-
tries like: Destroying allocator 'Connec-
tion/xxxxx/Pool/RowEngine/Session'
with x blocks and x bytes still allocated’ .
This known issue is related to memory management of FDA queries and is descri-
bed in SAP Note2580435 - Memory Leak in Pool/RowEngine/Session. This
may be solved by upgrading to a higher version of SAP HANA: HANA 01 SPS12
Revision 122.15 or higher, or, HANA 02 SPS01 Revision 012.04 or higher.
Further Information
Links to KBAs and SAP Notes which may be helpful :
• 1969700 - SAP HANA Statement Collection
• 1813020 - How to generate a runtime dump on SAP HANA
• 2399979 - How-To: Conguring automatic SAP HANA Data Collection with SAP HANASitter
• 2498739 - How-To: Analyzing Runtime Dumps with SAP HANA Dump Analyzer.
• 2000000 - FAQ: SAP HANA Performance Optimization
• 2222217
- How-To: Troubleshooting SAP HANA Startup Times
• 2222250 - FAQ: HANA Workload Management
• 2600030 - Parameter Recommendations in SAP HANA Environments
• 2114710 - FAQ: SAP HANA Threads and Thread Samples
50
PUBLIC
SAP HANA Troubleshooting and Performance Analysis Guide
Analyzing Generic Symptoms
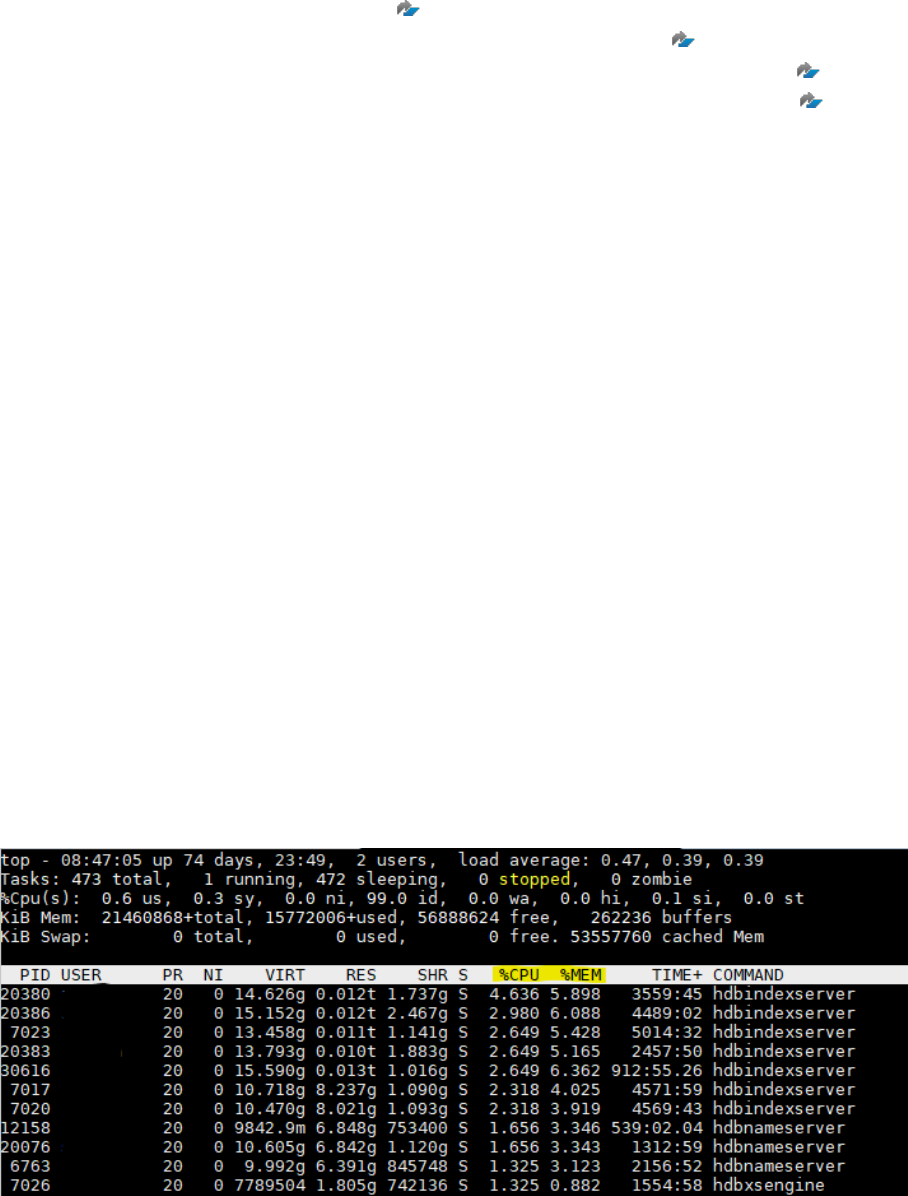
You can also use Guided Answers to analyze performance problems. The following Guided Answer trees are
focused on the SAP NetWeaver product:
• Master Guided Answer: Performance issues
• How to perform a Network analysis (Using Operation System Monitor - ST06)
• Analysis of Hardware Bottlenecks for Performance (Using Operation System Monitor - ST06)
• Performance Analysis Procedure for an ABAP Program (Using SAP Workload Monitor - ST03)
Related Information
ALTER SYSTEM {START | STOP | SAVE | CLEAR} KERNEL PROFILER Statement (System Management)
2.4.1.2 System Appears to Hang with no new Connections
and no Response from the SAP HANA Database
In cases where logs cannot be written, all DML statement will fall into wait status. This can lead to a failure
of opening new connections because the system internally executes DML statements during the process.
Typically, a full log volume is the cause for this.
Basic System Checks
In cases where the SAP HANA database is no longer responding to any requests it is advisable to follow
a bottom up approach to quickly identify the root cause of the problem. The following system checks will
eliminate common operating system related problems which often lead to system hanging situations:
Firstly, check the system resources at the operating system level, by using the TOP command:
Check the values for CPU and MEM to make sure that these resources are not exhausted.
SAP HANA Troubleshooting and Performance Analysis Guide
Analyzing Generic Symptoms
PUBLIC 51

Secondly, check the disk utilization by running the disk free command: df -h and verify that no volume has
reached 100% utilization (see example below).
Check whether you are able to connect to the indexserver process locally by using hdbsql to run a test-query,
for example:
SELECT CURRENT_TIMESTAMP FROM DUMMY;
If this is successful then check the network stability between the clients facing the issue and the SAP HANA
database host.
Possible Root Causes
Some common situations which cause a system to freeze are given here with remedial actions to take:
Root cause: Log volume full either caused by disk full or quota setting
Required action:
1. Check for the DISKFULL event in the indexserver trace or
2. Run the disk free command: df -h in the OS shell (the -h option is more readable and displays the output
in units of 1024). A result such as the following with a value of 100% will immediately identify the culprit as
a full log area:
/dev/mapper/vg_hana-log 102G 102G 0G 100% /hana/log
3. Check the quota setting in the le system.
4. If you have veried that the log volume is full then follow the procedure described in SAP Note 1679938 -
Log Volume is full.
You can nd additional information in SAP Note 2083715 - Analyzing log volume full situations.
Root cause: Log volume full caused by failure of log backup
Required action:
1. Check backup.log (located at /usr/sap/<SID>/HDB<Instance#>/<Host>/trace ) to see whether it
includes ERROR in log backup. Check M_BACKUP_CATALOG, M_LOG_SEGMENTS.
2. If log backup uses backint, please check backint.log (located at /usr/sap/<SID>/HDB<Instance#>/
<Host>/trace ) to see whether it includes ERROR information, and contact backint vendor support.
Admission Control
Note that if statements are rejected with SQL Error 1038 this is related to the Admission Control feature which
is designed to prevent the system from being overloaded by dening thresholds and either queuing or rejecting
statements when necessary. You can check whether admission control is preventing new sessions from being
established due to low system resources by querying the monitoring view M_ADMISSION_CONTROL_EVENTS:
SELECT * FROM M_ADMISSION_CONTROL_EVENTS;
52
PUBLIC
SAP HANA Troubleshooting and Performance Analysis Guide
Analyzing Generic Symptoms
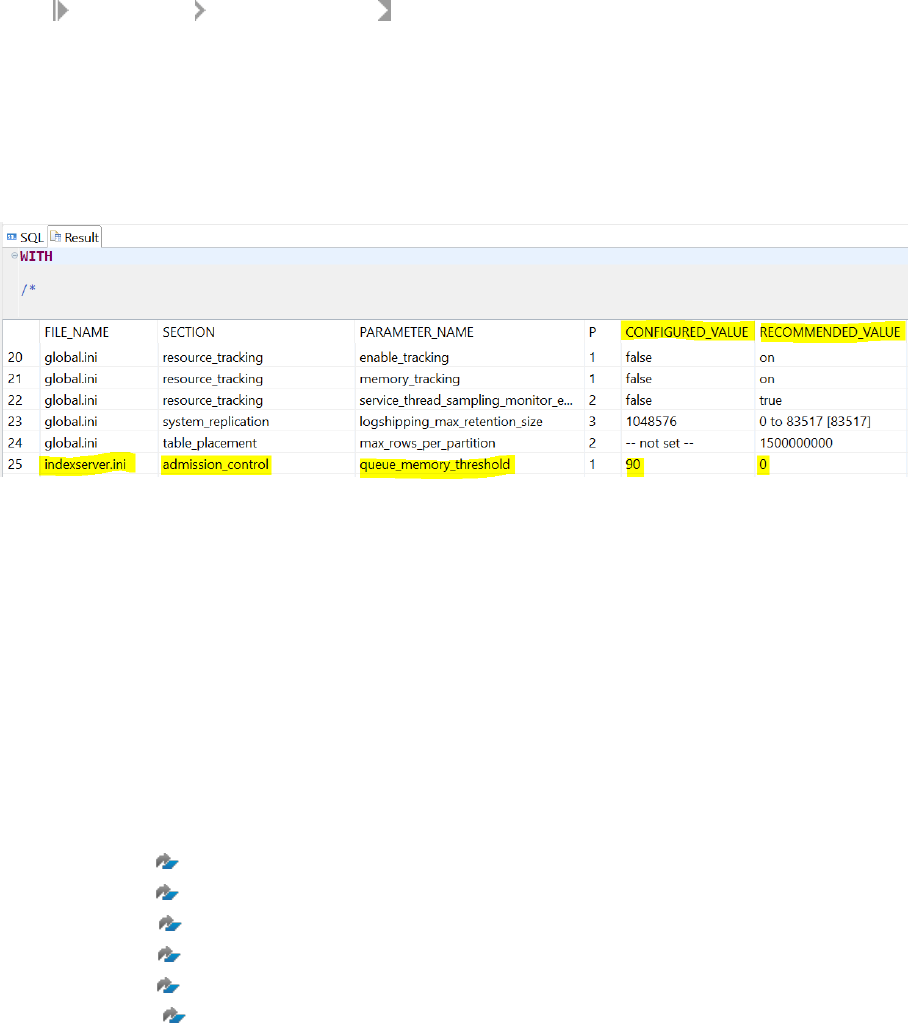
If many events are raised during the problematic time-period you should investigate which SAP HANA
resources were exhausted making it necessary for admission control to intervene. For more information about
Admission Control see the KBA 2222250 FAQ: SAP HANA Workload Management
Before SAP HANA 2 SPS05 Revision 056 there is a known coding issue where the Admission Control feature
could generate the SQL Error 1038 when there is no overloading of resources. For more information about this
issue see the KBA 3061965 - Unexpected Error "rejected as server is temporarily overloaded".
Conguration Parameters for Admission Control
You should apply the recommended settings for all admission control conguration parameters located
under indexserver.ini [admission_control] . You can check the parameter settings using the script
'HANA_Conguration_Parameters_2.00.040+' from the SAP Note 1969700 - SQL Statement Collection
for SAP HANA. The example output below from this script shows a discrepancy for the setting
queue_memory_threshold which is set to a value of 90 when on a SAP HANA Database with Revision
<= 2.00.053 it should be zero. The explanation for this setting is to avoid queuing in case of high
memory consumption that is often harmless (e.g. caused by a large page cache). The latest information
about recommended conguration parameter settings is maintained in SAP note 2600030 - Parameter
Recommendations in SAP HANA Environments.
Where Admission Control is functioning correctly the root cause for the Admission Control event(s)
is often high CPU, this can be conrmed for current Admission Control events using the script
'HANA_Workload_AdmissionControlEvents' or for historic Admission Control events using the script
'HANA_LoadHistory_Services' from the SAP Note 1969700 - SQL Statement Collection for SAP HANA.
For troubleshooting steps for high CPU analysis please see Analysis of CPU Related Issues.
Related Information
Analysis of CPU Related Issues [page 83]
SAP Note 1679938
SAP Note 2083715
SAP Note 2222250
SAP Note 3061965
SAP Note 1969700
SAP Note 2600030
SAP HANA Troubleshooting and Performance Analysis Guide
Analyzing Generic Symptoms
PUBLIC 53

2.4.1.3 System Appears to Hang with High System CPU
Usage
The SAP HANA database is an in-memory database and by its nature it consumes large amounts of memory.
Some performance issues of SAP HANA can be caused by the operating system's memory management
features.
For this case, you can see high usage of SYSTEM CPU that can be monitored in the Performance Monitor,
available from SAP HANA cockpit Monitoring and Administration CPU Usage .
You can begin an analysis of CPU related problems by running a Kernel Prole trace either:
• via the SQL console (see ALTER SYSTEM START KERNEL PROFILER statement)
• in hdbcons as described in KBA 1804811 SAP HANA Database: Kernel Proler Trace.
The kernel proler trace is required for analysis by SAP Support. Refer to the topic HANA System-wide
Performance Analysis for how to analyze the kernel proler trace. Refer to KBA 2222250 – FAQ: HANA
Workload Management which gives guidance on CPU-related conguration settings.
Root cause: Problem caused by the conguration of transparent huge page
Required action:
1. Check Transparent Huge Page whether it is set to [never] by running the command cat /sys/
kernel/mm/transparent_hugepage/enabled.
2. Apply KBA 2031375 - SAP HANA: Transparent HugePages (THP) setting on Linux.
Root cause: Problem caused by the conguration of OS page cache
Required action:
1. Check sar le ( /var/log/sa ) whether kbcached usage ( sar -r ) is higher than 10% of physical memory and
high page in/out occurred.
2. Check and apply SAP Note 1557506 - Linux paging improvements.
Root cause: Problem caused by translation lookaside buer (TLB) shootdown
Required action:
1. Check plan trace.
Root cause: Due to high context switches (High SYS CPU) by many SqlExecutor threads
Required action:
1. Check Performance Monitor and indexserver.ini -> sql -> sql_executors / max_sql_executors and refer to
Controlling Parallelism of SQL Statement Execution.
Related Information
Transparent Huge Pages on Linux [page 204]
System Hanging Situations [page 204]
HANA System-wide Performance Analysis [page 46]
Controlling Parallel Execution of SQL Statements [page 87]
54
PUBLIC
SAP HANA Troubleshooting and Performance Analysis Guide
Analyzing Generic Symptoms

SAP Note 2031375
SAP Note 1557506
SAP Note 2222250
SAP Note 1804811
2.4.1.4 Slower Response with High User CPU Usage
The performance may degrade with increased usage of the CPU and applications.
Root cause: Not many executor threads but high CPU in a few nodes and a few tables accessed
Required Action: In an SAP Business Warehouse system, check for non-even partitioning of huge column
tables. For more information, see SAP Note 1819123 - BW on SAP HANA SP5: landscape redistribution and
Indicator for Large Delta Storage of Column Store Tables.
Root Cause: Performance degradation by huge MVCC versions
Required Action: Check for KPI Active Version in the Performance Monitor to nd the MVCC garbage
blocker, then kill it via the Threads tile on the Overview page. For more information, see Troubleshooting Blocked
Transactions.
Refer also to the section 'Analysis of Former Performance Problems' in the topic HANA System-wide
Performance Analysis.
Related Information
Indicator for Large Delta Storage of Column Store Tables [page 131]
Blocked Transactions [page 167]
HANA System-wide Performance Analysis [page 46]
SAP Note 1819123
2.4.2Slow Individual SQL Statements
This section looks at the causes of slow individual SQL statements although there is no signicant performance
issue on system level and the associated troubleshooting steps.
If the following doesn’t help to resolve the problem, see Getting Support. In this case, to analyze further,
collect the explain plan, plan visualizer le, performance trace and catalog export. Also refer to SQL Statement
Analysis and Query Plan Analysis for more information. SAP KBA 2000002 - FAQ: SAP HANA SQL Optimization
explains general information about SQL optimization.
SAP HANA Troubleshooting and Performance Analysis Guide
Analyzing Generic Symptoms
PUBLIC 55

Related Information
SQL Statement Analysis [page 238]
Query Plan Analysis [page 248]
SAP Note 2000002
Getting Support
2.4.2.1 A Statement is Sometimes Slow and Sometimes
Fast
There are a number of things to check when you experience inconsistent query execution time.
Check the following possibilities:
Root Cause: Same query shows dierent execution plans according to the HANA SQL Plan Cache.
Required Action: Analyze the dierence in the execution plan by using the Explain Plan tool as outlined in SAP
Note 2410208 - Collect Explain Plan of a Prepared Statement.
Once you have found the corresponding statement hash for a problematic query, you can check how many
dierent plans are stored in the Plan Cache by running the following query:
SELECT PLAN_ID, STATEMENT_HASH FROM M_SQL_PLAN_CACHE WHERE STATEMENT_HASH =
'<statement_hash>'
Typically, the result will show multiple rows for a single statement hash value each with a dierent PLAN_ID
value. Using the Plan IDs listed in the result you can execute the statements given in SAP Note 2410208 to
display the execution plan and identify the dierences there.
Additionally, you can check why a new execution plan was generated by selecting the column
LAST_INVALIDATION_REASON. The reasons mentioned there are discussed in SAP KBA 2124112 - FAQ: SAP
HANA Parsing ('How can I determine the reason for a statement recompilation?')
If you want to prevent this from happening consider using the Plan Stability feature which captures the
execution plans of the SQL statements and applies them later when the statements are compiled again. In this
way Plan Stability can provide consistent performance across dierent revisions. You can use Plan Stability in
SAP HANA Cockpit or from the command line as described in the SQL Plan Stability section of this guide. The
following SAP Note gives additional information: 2639193 - SAP HANA SQL Plan Stability.
Root Cause: If a related table was unloaded, it takes some time to load tables
Required Action: Check unload trace and execute after table loaded fully. You can refer to LOADED column of
M_CS_TABLES.
Root Cause: Query compilation time is long.
Required Action: Check the execution time after adding 'with hint (ignore_plan_cache)' at the end of query.
This hint will always cause the query to be compiled. If a long running compiled query plan has been evicted
frequently from the plan cache, increase the query cache size. For more information, see SQL Plan Cache
Analysis.
Root Cause: Merge status of column table can aect query plan
56
PUBLIC
SAP HANA Troubleshooting and Performance Analysis Guide
Analyzing Generic Symptoms

Required Action: Check MEMORY_SIZE_IN_DELTA, RAW_RECORD_COUNT_IN_DELTA, and
LAST_MERGE_TIME columns of M_CS_TABLES whether there is large amount of data in delta. Check
M_DELTA_MERGE_STATISTICS to see when the last merge occurred. For more information, see Delta Merge.
Related Information
SQL Plan Cache Analysis [page 185]
Delta Merge [page 129]
SQL Plan Stability [page 283]
SQL Plan Stability (SAP HANA Cockpit)
SAP Note 2410208
SAP Note 2124112
SAP Note 2639193
2.4.2.2 A Statement is Slower After an Upgrade
After upgrade, the query execution time can be dierent because of changes in the query execution plan.
Root cause: After an upgrade, a query can have a dierent plan, which leads to a dierent execution time.
Required Action: If you have an instance running on an older revision, compare the plan and collect the plan
visualizer le. See Getting Support for further help.
Refer also to the SQL Plan Stability section of this guide; this feature oers the option to preserve a query's
execution plan by capturing an abstraction of the plan and reusing it after the upgrade to regenerate the
original plan and retain the original performance.
For more information, see Expensive SQL Statements.
Related Information
Expensive SQL Statements [page 76]
Analyzing SQL Execution with the Plan Visualizer [page 252]
SQL Plan Stability [page 283]
Getting Support
SAP HANA Troubleshooting and Performance Analysis Guide
Analyzing Generic Symptoms
PUBLIC 57

2.4.2.3 A Query on Multiple Nodes Can Be Slower
In distributed systems, query execution can be routed to other nodes for better performance. However, there is
a chance of having slow performance in the case where the network used for transferring intermediate results
generated during query execution is slow or where there is an inecient network conguration.
Root cause: A miscongured network can lead to slow queries.
Required Action: Check your network conguration and its bandwidth/latency among SAP HANA servers. For
more information see Network View and SAP Note 2183363 - Conguration of SAP HANA internal network.
Root cause: Statement routing and huge data transfer among distributed nodes can cause dierences of
query execution times due to the dierence of anchor nodes.
Required Action: Check how much data is transferred among distributed nodes and the network performance.
You can use the PlanViz Tool to check which nodes in the network are involved during the execution of the
query and how much data is transferred (see Overview Page, Plan Viz). The KPI values for the distribution
show:
• Number of nodes
• Number of network transfers
• Network trac
Consider the locations of joined tables to reduce transferred intermediate result size.
Related Information
Network View [page 260]
Performance Trace [page 288]
Overview Page [page 255]
SAP Note 2183363
2.4.2.4 Slow Select for all Entries (FAE) Query
There are a number of points to check if you have performance issues with SELECT FOR ALL ENTRIES (FAE)
from an ABAP query.
For FAE on SAP HANA, please generally refer to SAP Note 1662726 - Optimization of select with FOR ALL
ENTRIES on SAP HANA database.
Root cause: Indexes are missing.
Required Action: Check WHERE clause and check concat indexes for all elds used in WHERE clause.
Root cause: Due to DBSL behavior, slower operator can be chosen.
Required Actions: Apply parameters for ABAP optimization. For more information, see SAP Note 1987132 -
SAP HANA: Parameter setting for SELECT FOR ALL ENTRIES.
58
PUBLIC
SAP HANA Troubleshooting and Performance Analysis Guide
Analyzing Generic Symptoms

Root cause: When using less than or greater than ('<' or '>') lters in FAE query, it can be slower than having no
lter.
Required Actions: Do not use less than or greater than ('<' or '>') lters in an FAE query.
Related Information
SAP Note 1662726
SAP Note 1987132
2.4.2.5 All Statements Accessing a Specic Table are Slow
In case queries run on specic tables are slow, check if there are too many versions.
Root cause: If there are too many versions of single records, accessing the table can be slow. In this case, the
number of system-wide MVCC versions is in acceptable range. To verify further whether there are too many
versions for a specic table, check the result of this query:
SELECT * FROM M_RS_TABLE_VERSION_STATISTICS where table_name='mytable';
This can be caused by a cursor unnecessarily being held on a query result or a long-lived transaction without a
commit/rollback.
Required Action: Applications should commit as early as possible or close any cursors that are not needed.
Check the application logic to see whether it really needs to update single records frequently.
2.4.3Frequent Out of Memory (OOM)
If Out Of Memory situations happen frequently, it can also lead to performance drop by unloading tables or
shrinking memory jobs.
First check Memory Problems and SAP KBA 1999997 - FAQ: SAP HANA Memory as they provide information on
SAP HANA memory and its problems.
This section introduces common problems and their troubleshooting steps.
Related Information
Memory Problems [page 65]
SAP Note 1999997
SAP HANA Troubleshooting and Performance Analysis Guide
Analyzing Generic Symptoms
PUBLIC 59

2.4.3.1 Out of Memory Caused by Sudden Increased
Memory Usage
Check the memory consumption of statements in the event of OOMs caused by suddenly increased memory
usage.
Root cause: Huge intermediate results during query processing.
Required Actions: Enable memory tracking by setting the following parameters to on in the global.ini le
resource_tracking section.
• enable_tracking = on
• memory_tracking = on
Enable the Expensive Statement Trace by setting the status to Active.
Then, check the memory consumption of statements using M_EXPENSIVE_STATEMENTS.MEMORY_SIZE.
After your analysis you can optimize any problematic queries that were found.
2.4.3.2 Out of Memory Caused by Continuously Increased
Memory Usage
Check if many statements trigger an Out Of Memory in a system where used memory is continuously
increased.
Root cause: Commit/rollback within stored procedure can lead to memory leakages. Do not use
exec(“commit”) or exec(“rollback”) within a stored procedure. If this syntax is used, the system cannot reclaim
the memory used for query execution because its related transactions are left hanging.
Required Actions: Remove exec(“commit”) or exec(“rollback”). If you would like to use commit/rollback within
stored procedure, see SAP HANA SQLScript Reference for more information.
Root cause: Due to memory leakage caused by a programming error
Required Action: Check the Performance Monitor in
SAP HANA cockpit Overview Memory Usage to
determine whether used memory continuously increases without a signicant increase in data size. If you nd
a suspicious component which keeps allocating memory, create a support ticket attaching a full system dump,
mm trace, and the output of _SYS_STATISTICS.HOST_HEAP_ALLOCATORS_BASE.
Related Information
SAP HANA SQLScript Reference
60
PUBLIC
SAP HANA Troubleshooting and Performance Analysis Guide
Analyzing Generic Symptoms

2.4.3.3 Out of Memory While High Usage Of Column Store
Components' Allocators
If a system is undersized, Out Of Memory (OOM) can happen frequently.
Root cause: Undersized memory
Required Action:
1. Check top allocators in [MEMORY_OOM] section of OOM dump to see whether they are for column store
components as described in section 13 of KBA 1999997 - FAQ: SAP HANA Memory.
2. Check the unload trace whether frequent unloading of tables took place.
3. Reduce the amount of data in column store or increase physical memory.
Related Information
SAP Note 1999997
2.4.3.4 Out of Memory Caused by Large Memory Usage of
Statistics Server
This case can happen if the majority of memory used by the statisticsserver is due to many alerts or
undersized memory.
Root cause: Due to big STATISTICS_ALERTS_BASE table size, an OOM can occur.
Required Action: Check table size of _SYS_STATISTICS.STATISTICS_ALERTS_BASE and truncate
STATISTICS_ALERTS_BASE from hdbsql based on solution from SAP Note 2170779 - SAP HANA DB: Big
statistics server table leads to performance impact on the system.
Root cause: Big Pool/Statistics allocator size
Required Action: Check SAP Note 2147247 - FAQ: SAP HANA Statistics Server rst.
Related Information
SAP Note 2170779
SAP Note 2147247
SAP HANA Troubleshooting and Performance Analysis Guide
Analyzing Generic Symptoms
PUBLIC 61

2.4.3.5 Out of Memory Occurs due to High Usage of Shared
Memory
Shared memory is space where system information and row store tables are stored.
Check the following if the used amount of shared memory is high.
Root cause: Severely fragmented row store tables
Required action:
1. Check whether SHARED_MEMORY in [MEMORY_OOM] -> IPMM short info of OOM dump is unusally high.
2. Apply SAP Note 1813245 - SAP HANA DB: Row store reorganization.
Root cause: Memory shortage is caused by high usage of memory of row store tables in an SAP Business
Warehouse (BW) system
Required action: In an SAP Business Warehouse system the used amount of shared memory is high and SAP
Note 1813245 doesn't recommend row store reorganization, rst apply SAP Note 706478 - Preventing Basis
tables from increasing considerably, then apply SAP Note 1813245 - SAP HANA DB: Row store reorganization
again.
Root cause: Memory shortage is caused by high usage of memory of row store tables in non-SAP Business
Warehouse (BW) systems
Required Action: Check if you can convert some row store tables into column store tables or archive old data
to reduce the memory size, or else increase the system memory.
Related Information
SAP Note 1813245
SAP Note 706478
2.4.4Table Consistency Check
This section gives basic information for solving problems related to the Table Consistency Check.
The table consistency check is a procedure available in the SAP HANA database that performs a range of
consistency check actions on database tables. It can be run from the command line or scheduled within the
statistics service. Alert #83 Table Consistency is generated if the consistency check detects a given number of
errors.
62
PUBLIC
SAP HANA Troubleshooting and Performance Analysis Guide
Analyzing Generic Symptoms

Monitoring Views
Results of all consistency checks, whether executed manually or scheduled in the statistics service, are
available in two monitoring views:
• M_CONSISTENCY_CHECK_HISTORY
• M_CONSISTENCY_CHECK_HISTORY_ERRORS
The rst view gives high level information about parameters used for the check, runtime duration and the total
number of tables with errors; each run is identied by a CHECK_EXECUTION_ID value. The errors table lists
and gives details of all errors found within each check run.
Additionally, the monitoring view M_CS_TABLES, holds values for: LAST_CONSISTENCY_CHECK_TIME,
LAST_CONSISTENCY_CHECK_ERROR_COUNT.
Common Errors
If you encounter errors when running the table consistency check you should rst try to rerun the check as
some errors may only be due to timing issues related to the current workload and would not occur again if the
table consistency check is repeated.
If the same error does recur check the following trace les:
• Database trace le available in SAP HANA Studio or Database Explorer:
<service>_<host>.<port>.<counter>.trc
• Dedicated trace le: <service>_<host>.<port>.table_consistency_check.<timestamp>.trc. For this trace
le the parameter enable_table_consistency_check_trace must be enabled.
If necessary, increase the trace level to debug to get sucient diagnostic information:
ALTER SYSTEM ALTER CONFIGURATION ('indexserver.ini', 'SYSTEM')
SET ('trace', 'table_consistency_check') = 'debug'
Search the trace le for any errors and make a note of the error code. This information will be helpful if it is
nally necessary to contact SAP Support for assistance.
More Information
For background information see Table Consistency Check in the SAP HANA Administration Guide. Refer also to
the following SAP Notes:
• 2116157 - FAQ: SAP HANA Consistency Checks and Corruptions
• 1977584 - Technical Consistency Checks for SAP HANA Databases
SAP HANA Troubleshooting and Performance Analysis Guide
Analyzing Generic Symptoms
PUBLIC 63


3 Root Causes and Solutions
This section provides detailed information on the root causes of problems and their solutions.
System alerts are a good indicator for the underlying problem. The SAP Notes you will be directed to are
a source of background information, explanations, alternative options, FAQs or useful SQL statements, for
example. Detailed monitoring and administration of the SAP HANA databases is possible via the SAP HANA
cockpit and the SAP HANA database explorer.
3.1 Memory Problems
This section discusses the analysis steps that are required to identify and resolve memory related issues in the
SAP HANA database.
For general information on SAP HANA memory management see the SAP HANA Academy video SAP HANA
Memory Management which discusses the memory concept and comments on the dierence between used,
allocated, and resident Memory.
Alerts related to memory problems and corresponding SAP Notes are documented in the Alerts reference
table (see category 'Memory'). SAP Note 1840954 – Alerts related to HANA memory consumption includes
information on how to analyze out-of-memory (OOM) dump les.
The SAP HANA Administration Guide gives details on using the tool SAP HANA cockpit to analyze memory
problems.
In order to understand the current and historic SAP HANA memory consumption you can use the following
tools and approaches:
• Memory information in SAP HANA cockpit
• Memory information from logs and traces
• Memory information from SQL commands
• Memory information from other tools (see the tools overview in the SAP HANA Administration Guide).
Related Information
SAP Note 1840954
Alerts Reference [page 301]
SAP HANA Administration Guide
Video HANA Academy: SAP HANA Memory Management
SAP HANA Troubleshooting and Performance Analysis Guide
Root Causes and Solutions
PUBLIC 65
3.1.1Memory Information in SAP HANA Cockpit
There are a number of sources of information in SAP HANA cockpit that can assist you in understanding
memory utilization.
• Open the Manage Services page from the Overall Database Status tile for high-level information about
physical memory, allocation limit, and used memory for each service.
• To get a graphical overview about physical memory, allocation limit, used memory, and resident memory
open the Performance Monitor from the Memory Usage tile.
• Open the Memory Analysis app from the Memory Usage tile for details about memory utilization as well as
history information. For example, click the Components tab in the Memory Analysis app to view the used
memory grouped by dierent components like "Statement Execution & Intermediate Results" or "Column
Store Tables". When you choose a component, the corresponding historic information of memory usage is
displayed by a graph.
3.1.2Memory Information from Logs and Traces
In case of critical memory issues you can often nd more detailed information in logs and trace les.
• Try to identify memory-related errors in the alert trace les in the SAP HANA database explorer (accessible
via the View trace and diagnostic les link). Search for the strings “memory”, “allocat”, or “OOM” (case-
insensitive).
• Check if an out-of-memory (OOM) trace le was created.
• Investigate error messages seen on the application side that occurred at times of high memory usage. If
the application is an SAP NetWeaver system, good starting points for analysis are System Log (SM21),
ABAP Runtime Error (ST22), and Job Selection (SM37).
If help from SAP Customer Support is needed to perform an in-depth analysis, the following information is
valuable and should be added to the ticket:
• Diagnosis information (full system info dump). To collect this information, see section Diagnosis
Information.
• Performance trace provides detail information on the system behavior, including statement execution
details. The trace output is written to a trace le perftrace.tpt, which must be sent to SAP Customer
Support. Please note that the trace must be captured while the issue is present or while reproducing the
issue. To enable this trace, see section Performance Trace under Additional Analysis Tools for Support.
If specic SAP HANA system components need deeper investigation, SAP Customer Support can ask you to
raise the corresponding trace levels to INFO or DEBUG, rerun the query and then send the indexserver trace
les to SAP Customer Support.
To do so choose Trace Conguration in the SAP HANA database explorer and launch the Database Trace
wizard. The following illustration shows the example of enabling the join engine trace (join_eval). You can enter
a search string and then select the component in the indexserver.ini le and change the System Trace
Level to the appropriate value. Some trace components (such as debug trace details for join engine) can
create many megabytes of trace information and may also require an increase of the values maxfiles and
maxfilesize in the [trace] section of the global.ini le (see also SAP Note 2629103 - SQL Traces Stop
Writing When it Exceeds the Maximum Filesize).
66
PUBLIC
SAP HANA Troubleshooting and Performance Analysis Guide
Root Causes and Solutions
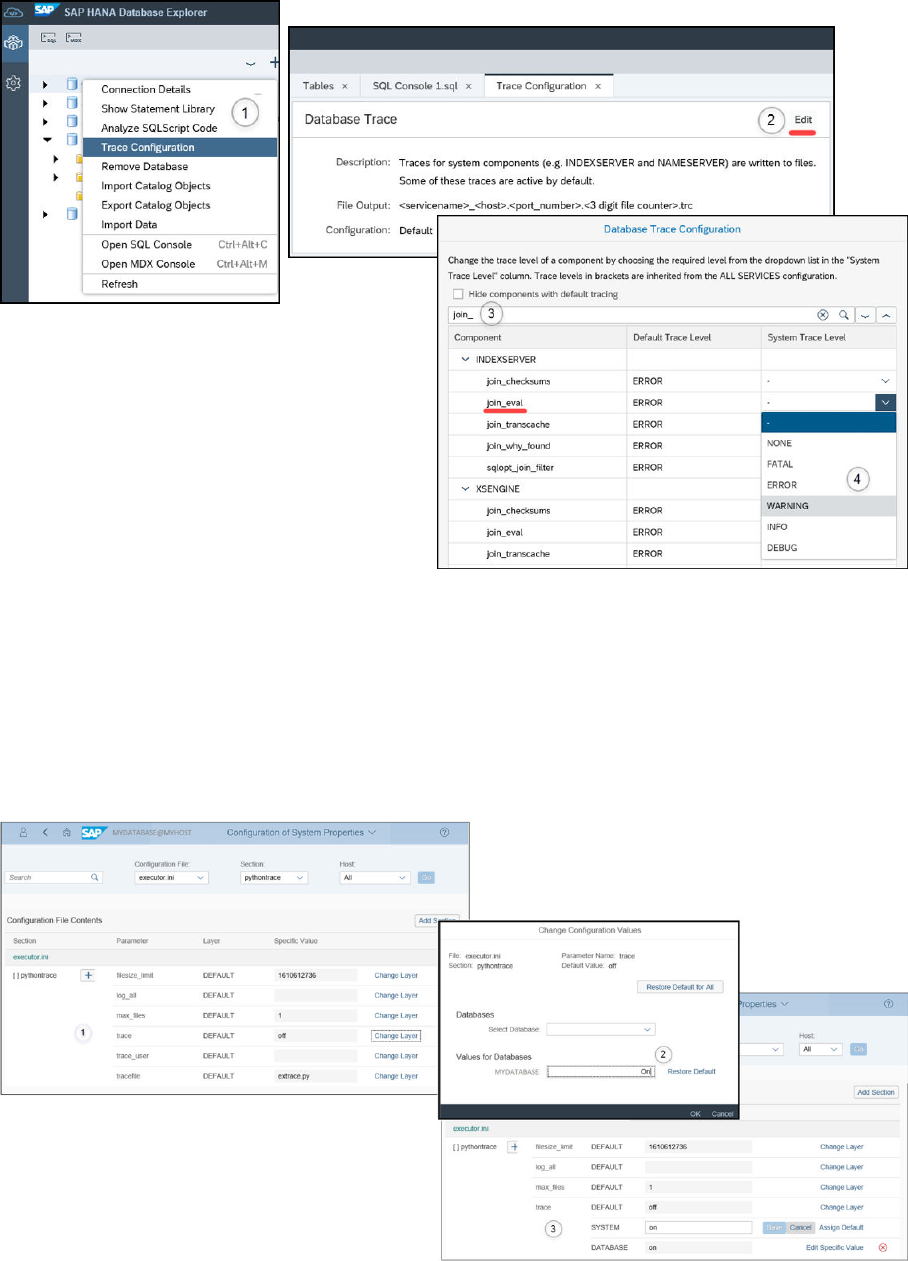
Internal details about SQL statement execution can be collected by enabling the Executor Trace; this provides
the highest level of detail and should only be activated for the short time of query execution. After capturing
the trace details you can upload the trace le (extrace.py) to SAP Customer Support. This trace is enabled by
activating a conguration parameter as described and illustrated here.
Open the Conguration of System Properties view, edit the parameter trace in the [pythontrace] section of the
executor.ini le, and change its value to on. When you change the default value, you have the option to set
values at each specic layer. The trace parameter is o by default. Click Change Layer to turn the parameter
on. You can then change the conguration value for a selected database and for a selected layer:
SAP HANA Troubleshooting and Performance Analysis Guide
Root Causes and Solutions
PUBLIC 67

Related Information
Diagnosis Information [page 292]
Performance Trace [page 288]
SAP Note 2629103
3.1.3Memory Information from SQL Commands
There are a number of ways to analyze memory usage based on pre-dened and modiable SQL queries.
The Statement Library of SAP HANA database explorer provides a set of tabular views to display the memory
consumption of loaded tables based on pre-dened SQL queries:
• The view Component Memory Usage shows the aggregated memory consumption in bytes for dierent
heap memory service components, services, and ports. Order by the used memory size column and nd
the largest consumers. The following heap memory service components are available: 1) Column Store
Tables, 2) Row Store Tables, 3) Statement Execution & Intermediate Results, 4) Monitoring & Statistical
Data, 5) Caches, 6) System, 7) Code Size, 8) Stack Size.
• The view Schema Size of Loaded Tables displays the aggregated memory consumption of loaded tables in
MB for dierent database schemas. The aggregation comprises both column store and row store tables.
Order by the schema size column and nd the largest consumers.
• The view Used Memory by Tables shows two values: the total memory consumption of all column store
tables in MB and the total memory consumption of all row store tables in MB.
Note
You can nd this and other information in the Memory Analysis app of the SAP HANA cockpit. For more
information, see Analyze Memory Statistics in the SAP HANA Administration Guide.
SQL Statement Collection
SAP Note 1969700 – SQL Statement Collection for SAP HANA contains several commands that are useful to
analyze memory-related issues. Based on your needs you can congure restrictions and parameters in the
sections marked with /* Modification section */.
Some of the memory-related statements which you may nd useful are described here:
• HANA_Memory_Overview
• HANA_Memory_TopConsumers* - available in two versions depending on the release. The output of the
statement is the same in both cases:
• HANA_Memory_TopConsumers_History (available in older versions of the statement collection)
• HANA_Memory_TopConsumers_TimeSlices (supersedes 'Consumers History' in versions SPS 04 and
above)
• HANA_Tables_LargestTables
68
PUBLIC
SAP HANA Troubleshooting and Performance Analysis Guide
Root Causes and Solutions

• HANA_Memory_SharedMemory
HANA_Memory_Overview
This query gives an overview of current memory information showing key values in the following columns:
• NAME: Description
• TOTAL_GB: Total size (GB)
• DETAIL_GB: Size on detail level (GB) – this is shown at two levels with a breakdown at a second level – see
the following table:
NAME
TOTAL_GB DETAIL_GB DETAIL2_GB
User-dened global allocation limit not set
License memory limit 256
License usage 143 124 (2014/03/01-2014/03/31)
143 (2014/04/01-2014/04/30)
113 (2014/05/01-2014/05/09)
Physical memory 256 256 (vhbshk0sdb)
HANA instance memory
(allocated)
113 113 (vhbshk0sdb)
HANA instance memory (used) 85 85 (vhbshk0sdb)
HANA shared memory 23 23 (vhbshk0sdb)
HANA heap memory (used) 52 52 (vhbshk0sdb) 10 (Pool/NameIdMapping/
RoDict)
HANA_Memory_TopConsumers_History / HANA_Memory_TopConsumers_TimeSlices
The output shows the areas in history with the highest memory requirements (column store and row store
tables, heap, code, stack). The following columns contain the key values:
• SAMPLE_TIME: Timestamp
• KEY_FIGURE: Memory key gure
• VALUE_TOTAL: Total value of memory key gure
• DETAIL_<n>: Top <n> detail area related to memory key gure
• VALUE_<n>: Memory key gure value of top <n> detail area
• PCT_<n>: Fraction of overall value occupied by top <n> detail area (%)
SAMPLE_TIME
KEY_FIGURE
VALUE_TOT
AL DETAIL_1 VALUE_1 PCT_1
2014/04/22(TUE) Space used (GB) 408.55 Pool/PersistenceManager/
PersistentSpace(0)/DefaultLPA/Page
85.94 21
2014/04/21(MON) Space used (GB) 382.82 Pool/PersistenceManager/
PersistentSpace(0)/DefaultLPA/Page
90.44 24
SAP HANA Troubleshooting and Performance Analysis Guide
Root Causes and Solutions
PUBLIC 69
SAMPLE_TIME KEY_FIGURE
VALUE_TOT
AL DETAIL_1 VALUE_1 PCT_1
2014/04/20(SUN) Space used (GB) 437.76 Pool/PersistenceManager/
PersistentSpace(0)/DefaultLPA/Page
126.20 29
2014/04/19(SAT) Space used (GB) 513.70 Pool/PersistenceManager/
PersistentSpace(0)/DefaultLPA/Page
133.29 26
2014/04/18(FRI) Space used (GB) 445.53 Pool/PersistenceManager/
PersistentSpace(0)/DefaultLPA/Page
112.35 25
2014/04/17(THU) Space used (GB) 363.30 Pool/RowEngine/QueryExecution 72.54 20
2014/04/16(WED) Space used (GB) 487.59 Pool/RowEngine/QueryExecution 104.39 21
2014/04/15(TUE) Space used (GB) 588.56 Pool/PersistenceManager/
PersistentSpace(0)/DefaultLPA/Page
168.21 29
2014/04/14(MON) Space used (GB) 3484.97 Pool/JoinEvaluator/
JERequestedAttributes/Results
2795.20 80
2014/04/13(SUN) Space used (GB) 572.90 Pool/PersistenceManager/
PersistentSpace(0)/DefaultLPA/Page
175.60 31
2014/04/12(SAT) Space used (GB) 477.98 Pool/PersistenceManager/
PersistentSpace(0)/DefaultLPA/Page
111.76 23
2014/04/11(FRI) Space used (GB) 491.72 Pool/PersistenceManager/
PersistentSpace(0)/DefaultLPA/Page
119.74 24
2014/04/10(THU) Space used (GB) 463.47 Pool/PersistenceManager/
PersistentSpace(0)/DefaultLPA/Page
100.82 22
HANA_Tables_LargestTables
This query provides an overview of current memory allocation by tables. The following list explains the columns
displayed in the table:
• OWNER: Name of the table owner
• TABLE_NAME: Name of the table
• S: Table store ('R' for row store, 'C' for column store)
• HOST: Host name ('various' in case of partitions on multiple hosts)
• U: 'X' if at least one unique index exists for the table
• POS: Position of table in top list
• COLS: Number of table columns
• RECORDS: Number of table records
• SUM_DISK_GB: Total size on disk (in GB, table + indexes + LOB segments)
• SUM_MEM_GB: Total potential maximum size in memory (in GB, table + indexes + LOB segments)
70
PUBLIC
SAP HANA Troubleshooting and Performance Analysis Guide
Root Causes and Solutions

OWNER TABLE_NAME S HOST U POS COLS RECORDS
SUM_DIS
K_GB
SUM_ME
M_GB
SAPSR3 /BIC/AZOCEUO0500 C various X 1 16 877829360 63.90 76.15
SAPSR3 /BIC/AZOCZZO0400 C various X 2 33 965035392 63.45 70.10
SAPSR3 RSMONMESS R erslha33 X 3 19 170801504 27.92 54.21
SAPSR3 /BIC/AZFIGLO1300 C various X 4 60 652633189 47.20 53.23
SAPSR3 /BIC/AZSCXXO4400 C various X 5 26 1251448665 47.78 53.04
SAPSR3 /BIC/AZOCEUO0800 C various X 6 17 911830438 37.86 52.42
SAPSR3 /BIC/AZOCZZO2000 C various X 7 34 1200422292 46.50 50.08
SAPSR3 RSWR_DATA R erslha33 X 8 10 20471 36.88 36.88
SAPSR3 RSRWBSTORE C erslha33 X 9 5 14483956 36.18 36.20
SAPSR3 /BIC/AZMIEUO0200 C various X 10 52 403915330 28.58 33.05
SAPSR3 /BIC/AZSCXXO2900 C various X 11 275 183029330 30.82 29.26
SAPSR3 /BIC/AZSCXXO4700 C various X 12 42 648103462 27.38 28.83
SAPSR3 /BIC/FZRREUC16B C erslha35 13 122 258261262 26.43 24.99
SAPSR3 /BIC/AZOCEUO9000 C various X 14 16 251896248 20.53 23.71
SAPSR3 RSBMNODES R erslha33 X 15 12 130344869 13.67 20.25
SAPSR3 /BIC/AZSCXXO1400 C various X 16 279 164509638 18.49 19.82
SAPSR3 /BIC/AZOCEUO0300 C various X 17 27 577787981 17.95 19.60
SAPSR3 EDI40 R erslha33 X 18 7 5733625 18.26 18.40
SAPSR3 /BIC/FZOCZZC20 C various 19 34 1427403108 18.97 17.80
SAPSR3 /BIC/AZSCXXO2600 C various X 20 306 95251083 16.65 16.97
SAPSR3 /BIC/AZSCXXO0800 C various X 21 266 120598787 18.76 15.62
SAPSR3 /BIC/AZSPXXO0200 C various X 22 48 270975902 12.63 15.30
SAPSR3 /BIC/AZOCZZO5000 C various X 23 33 215732874 14.16 14.92
SAPSR3 /BIC/AZSPXXO0300 C various X 24 56 275036362 13.09 14.77
SAPSR3 /BIC/AZOCEUO0600 C various X 25 16 663581081 12.29 14.34
SAP HANA Troubleshooting and Performance Analysis Guide
Root Causes and Solutions
PUBLIC 71
OWNER TABLE_NAME S HOST U POS COLS RECORDS
SUM_DIS
K_GB
SUM_ME
M_GB
SAPSR3 /BIC/AZOCZZO0700 C various X 26 41 350819182 15.00 14.32
SAPSR3 /BIC/FZRREUC16D C erslha40 27 122 146620284 15.39 14.06
SAPSR3 /BIC/AZMDEUO0800 C various X 28 246 151145647 15.39 14.00
SAPSR3 /BIC/AZMIEUO1300 C various X 29 16 406548712 11.52 13.35
SAPSR3 /BIC/AZRREUO0100 C various X 30 167 202422848 15.36 13.24
HANA_Memory_SharedMemory
This query shows currently used and allocated shared memory per host and service. The following list explains
the columns displayed in the table:
• HOST: Host name
• PORT: Port name
• SERVICE_NAME: Service name
• SHM_ALLOC_GB: Allocated shared memory (GB)
• SHM_USED_GB: Used shared memory (GB)
• SHM_USED_PCT: Percentage of allocated memory used
HOST
PORT SERVICE_NAME SHM_ALLOC_GB SHM_USED_GB SHM_USED_PCT
MyHost01 31001 nameserver 0.13 0.02 18.64
MyHost01 31002 preprocessor 0.00 0.00 0.00
MyHost01 31003 indexserver 24.50 11.21 45.76
MyHost01 31005 statisticsserver 0.14 0.03 22.98
MyHost01 31006 webdispatcher 0.00 0.00 0.00
MyHost01 31007 xsengine 0.14 0.03 22.96
MyHost01 31010 compileserver 0.00 0.00 0.00
Related Information
SAP Note 1969700
Memory Analysis
Using the SQL Statement Collection for Analysis and Health Checks [page 8]
72
PUBLIC
SAP HANA Troubleshooting and Performance Analysis Guide
Root Causes and Solutions

3.1.4Memory Information from Other Tools
Other tools are also available to analyze high memory consumption and out-of-memory situations.
A number of SAP Notes and 'How-to' documents are available to provide help with some of the most common
questions and diculties related to memory. The tool hdbcons provides expert functionality to analyze
memory issues. You can use this tool (typically with guidance from the SAP Product Support team) to create
runtime dump les and analyze the details of memory consumption. If necessary, dump les can be sent to
Product Support for further analysis.
The following SAP Notes may be helpful in solving some problems and when analyzing memory issues with
hdbcons.
• 1999997 FAQ: SAP HANA Memory
• 2400007 FAQ: SAP HANA Runtime Dumps
• 2222218 FAQ: SAP HANA Database Server Management Console (hdbcons)
• 1786918 Required information to investigate high memory consumption (hdbcons)
• 1813020 How to generate a runtime dump on SAP HANA
• 1984422 How-To: Analyzing SAP HANA Out-of-memory (OOM) Dumps
• How to troubleshoot HANA High Memory Consumption (Guided Answer)
Tip
Guided Answers is a support tool for troubleshooting problems using decision trees. A guided answer is
available for How to troubleshoot HANA High Memory Consumption.
Related Information
SAP Note 1999997
SAP Note 2400007
SAP Note 2222218
SAP Note 1786918
SAP Note 1813020
SAP Note 1984422
How to troubleshoot HANA High Memory Consumption (Guided Answer)
3.1.5Root Causes of Memory Problems
Once you have completed your initial analysis, you have the information required to start the next phase of your
analysis.
Based on the results from the analysis approaches you are now able to answer the following questions:
• Is it a permanent or a sporadic problem?
SAP HANA Troubleshooting and Performance Analysis Guide
Root Causes and Solutions
PUBLIC 73
• Is the memory consumption steadily growing over time?
• Are there areas with critical memory consumption in heap, row store or column store?
• Is there a big dierence between used memory and allocated memory?
In the following you can nd typical root causes and possible solutions for the dierent scenarios.
A valuable tool for analyzing memory problems is the Expensive Statements Trace which is useful in cases
where individual statements seem to exhaust the system's memory. This is described separately in the Tools
and Tracing section: Analyzing Expensive Statements Traces.
Related Information
Analyzing Expensive Statements Traces [page 243]
3.1.5.1 Signicant External Memory Consumption
If the database resident memory of all SAP HANA databases on the same host is signicantly smaller than the
total resident memory, you have to check which processes outside of the SAP HANA databases are responsible
for the additional memory requirements.
Typical memory consumers are:
• Operating system (for example, caches, mapping structures)
• Third party tools (for example, backup, virus scanner)
How to identify top memory consumers from non-SAP HANA processes is out of scope of this guide. However,
when you are able to identify the reason for the increased memory consumption of the external program, you
can check if it is possible to optimize its conguration.
3.1.5.2 Space Consumed by Large Tables
If particularly large tables consume signicant amounts of space in the row store or column store, you should
check if the amount of data can be reduced.
The following references will be helpful:
• SAP Note 2388483 - How To: Data Management for Technical Tables describes archiving and deletion
strategies for typical SAP tables with a technical background; for example, tables required for
communication, logging or administration.
• General recommendations for managing data can be found on the Information Lifecycle Management page.
For more information on memory management for resident table data, see Managing Tables in the SAP HANA
Administration Guide and the following SAP Notes:
• SAP Note 2222277 - FAQ: SAP HANA Column Store and Row Store
• SAP Note 2220627 - FAQ: SAP HANA LOBs
74
PUBLIC
SAP HANA Troubleshooting and Performance Analysis Guide
Root Causes and Solutions

• SAP Note 2388483 - How-To: Data Management for Technical Tables
Related Information
https://www.sap.com/products/information-lifecycle-management.html
Managing Tables
SAP Note 2222277
SAP Note 2220627
SAP Note 2388483
3.1.5.3 Internal Columns in the Column Store
For several reasons, SAP HANA creates internal columns in the column store. Some column store tables are
automatically loaded into memory.
Internal Columns
You may be able to optimize or remove internal columns in order to reduce memory usage. In some situations
a cleanup is possible, for example, in the case of CONCAT attribute columns that were created in order to
support joins. For more information see SAP Note 1986747: How-To: Analyzing Internal Columns in SAP HANA
Column Store.
Column Store Table Loads and Unloads
The SAP HANA system dynamically loads column store tables into memory during system restart and
when required by the application. You may be able to optimize the number of pre-loaded tables. For more
information, see SAP Note 2127458: FAQ: SAP HANA Loads and Unloads.
Related Information
SAP Note 2127458
SAP Note 1986747
3.1.5.4 Memory Leaks
A memory leak is a memory area (typically a heap allocator) that grows over time without any apparent reason.
If you have identied a suspicious area, proceed as follows:
• Check for SAP Notes that describe the memory leak and provide a solution.
• Check if the problem is reproducible with a recent SAP HANA revision.
SAP HANA Troubleshooting and Performance Analysis Guide
Root Causes and Solutions
PUBLIC 75

• If you can’t resolve the problem yourself, open an SAP customer message and use the component HAN-
DB.
Before you open a Support incident refer to SAP Note 1786918 - Required information to investigate high
memory consumption.
Information about a specic memory area can be obtained from the output of the following hdbcons command
giving the name of the heap allocator as a parameter. This information is also particularly helpful to the
Support team when analyzing memory problems.
hdbcons "mm -bl <allocator_name>"
Related Information
SAP Note 1786918
Problem Analysis Using hdbcons
3.1.5.5 Large Heap Areas
Some heap areas can be larger than necessary without being a memory leak.
SAP Note 1840954 – Alerts Related to HANA Memory Consumption contains an overview of heap allocators
with a potentially large memory consumption and possible resolutions.
Refer also to SAP Note 1999997 – FAQ: SAP HANA Memory.
Related Information
SAP Note 1840954
SAP Note 1999997
3.1.5.6 Expensive SQL Statements
SQL statements processing a high amount of data or using inecient processing strategies can be responsible
for increased memory requirements.
See SQL Statement Analysis for information on how to analyze expensive SQL statements during times of peak
memory requirements.
76
PUBLIC
SAP HANA Troubleshooting and Performance Analysis Guide
Root Causes and Solutions
Related Information
SQL Statement Analysis [page 238]
Setting a Memory Limit for SQL Statements [page 79]
Analyzing Expensive Statements Traces [page 243]
3.1.5.7 Memory Consumption Related to Transactional
Problems
High memory consumption can be caused by problems with transactions.
In some cases, high memory consumption is caused by wait situations, which can have dierent reasons:
• Long-running or unclosed cursors,
• Blocked transactions,
• Hanging threads.
As one of the negative impacts, used memory is not released any more. In particular, the number of table
versions can grow up to more than 8,000,000 which is considered the amount where an action is required.
For more information, see the separate section Transactional Problems.
Related Information
Transactional Problems [page 167]
3.1.5.8 Used Space Much Smaller than Allocated Space
In order to optimize performance by minimizing the memory management overhead or due to fragmentation,
SAP HANA may allocate additional memory rather than reusing free space within the already allocated
memory.
This can lead to undesired eects that the SAP HANA memory footprint increases without apparent need.
The SAP HANA license checks against allocated space, so from a licensing perspective it is important to keep
the allocated space below the license limit.
In order to limit the amount of allocated space, you can set the parameter global_allocation_limit to a
value not larger than the maximum memory that should be allocated.
See Set the global_allocation_limit Parameter in the SAP HANA Administration Guide.
SAP HANA Troubleshooting and Performance Analysis Guide
Root Causes and Solutions
PUBLIC 77

Related Information
Change the Global Memory Allocation Limit
3.1.5.9 Fragmentation
Fragmentation eects are responsible for ineciently used memory. They can occur in dierent areas.
In order to minimize fragmentation of row store tables you can proceed as follows:
• If the fragmentation of row store tables in the shared memory segments of indexserver processes reaches
30% and the allocated memory size is greater than 10GB, a table redistribution operation is needed.
SAP Note 1813245 - SAP HANA DB: Row Store reorganization describes how to determine fragmentation and
perform a table redistribution.
Related Information
SAP Note 1813245
3.1.5.10Large Memory LOBs
LOB (Large Object) columns can be responsible for signicant memory allocation in the row store and column
store if they are dened as memory LOBs.
To check for memory LOBs and switch to hybrid LOBs see SAP Note 1994962 – Activation of Hybrid LOBs in
SAP HANA.
Related Information
SAP Note 1994962
3.1.5.11Large Delta Store
The delta store can allocate a signicant portion of the column store memory.
You can identify the current size of the delta store by running the SQL command:
HANA_Tables_ColumnStore_Overview (SAP Note 1969700 – SQL Statement Collection for SAP HANA).
If the delta store size is larger than expected, proceed as described in the section Delta Merge.
78
PUBLIC
SAP HANA Troubleshooting and Performance Analysis Guide
Root Causes and Solutions

Related Information
SAP Note 1969700
Delta Merge [page 129]
3.1.5.12Undersized SAP HANA Memory
If a detailed analysis of the SAP HANA memory consumption didn’t reveal any root cause of increased memory
requirements, it is possible that the available memory is not sucient for the current utilization of the SAP
HANA database.
In this case you should perform a sizing verication and make sure that sucient memory is installed on the
SAP HANA hosts.
3.1.5.13Setting a Memory Limit for SQL Statements
You can set a statement memory limit to prevent single statements from consuming too much memory.
Prerequisites
To apply these settings you must have the system privilege INIFILE ADMIN.
For these options, enable_tracking and memory_tracking must rst be enabled in the global.ini le.
Additionally, resource_tracking must be enabled in this le if you wish to apply dierent settings for
individual users (see Procedure below).
Context
You can protect an SAP HANA system from uncontrolled queries consuming excessive memory by limiting
the amount of memory used by single statement executions per host. By default, there is no limit set on
statement memory usage, but if a limit is applied, statement executions that require more memory will
be aborted when they reach the limit. To avoid canceling statements unnecessarily you can also apply a
percentage threshold value which considers the current statement allocation as a proportion of the global
memory currently available. Using this parameter, statements which have exceeded the hard-coded limit may
still be executed if the memory allocated for the statement is within the percentage threshold. The percentage
threshold setting is also eective for workload classes where a statement memory limit can also be dened.
You can also create exceptions to these limits for individual users (for example, to ensure an administrator is
not prevented from doing a backup) by setting a dierent statement memory limit for each individual.
SAP HANA Troubleshooting and Performance Analysis Guide
Root Causes and Solutions
PUBLIC 79
These limits only apply to single SQL statements, not the system as a whole. Tables which require much more
memory than the limit applied here may be loaded into memory. The parameter global_allocation_limit
limits the maximum memory allocation limit for the system as a whole.
You can view the (peak) memory consumption of a statement in M_EXPENSIVE_STATEMENTS.MEMORY_SIZE.
Procedure
1. Enable statement memory tracking.
In the global.ini le, expand the resource_tracking section and set the following parameters to on:
• enable_tracking = on
• memory_tracking = on
2. statement_memory_limit - denes the maximum memory allocation per statement in GB. The
parameter is not set by default.
• In the global.ini le, expand the memorymanager section and locate the parameter. Set an integer
value in GB between 0 (no limit) and the value of the global allocation limit. Values that are too small
can block the system from performing critical tasks.
• An option is also available to apply a limit in relation to the system’s eective allocation limit. To do
this, set the parameter to a value of '-1'. In this case a memory limit is applied calculated as 25% of the
smaller of the global_allocation_limit and the process_allocation_limit.
• A value for this parameter may also be set during installation or upgrade by hdblcm.
• The value dened for this parameter can be overridden by the corresponding workload class property
STATEMENT_MEMORY_LIMIT.
• When the statement memory limit is reached, a dump le is created with 'compositelimit_oom' in
the name. The statement is aborted, but otherwise the system is not aected. By default only one
dump le is written every 24 hours. If a second limit hits in that interval, no dump le is written.
The interval can be congured in the memorymanager section of the global.ini le using the
oom_dump_time_delta parameter, which sets the minimum time dierence (in seconds) between
two dumps of the same kind (and the same process).
After setting this parameter, statements that exceed the limit you have set on a host are stopped by
running out of memory.
3. statement_memory_limit_threshold - denes a percentage of the global allocation limit. Parameter
statement_memory_limit is respected only if total used memory exceeds the global allocation
limit by this threshold percentage. The default value is 0% (of the global_allocation_limit) so
statement_memory_limit is always respected.
• In the global.ini le, expand the memorymanager section and set the parameter as a percentage of
the global allocation limit.
• This parameter provides a means of controlling when the statement_memory_limit is applied. If
this parameter is set, when a statement is issued the system will determine if the amount of memory
it consumes exceeds the dened percentage value of the overall global_allocation_limit
parameter setting. The statement memory limit is only applied if the current SAP HANA memory
consumption exceeds this statement memory limit threshold as a percentage of the global allocation
limit.
• This is a way of determining if a particular statement consumes an inordinate amount of memory
compared to the overall system memory available. If so, to preserve memory for other tasks, the
statement memory limit is applied and the statement fails with an exception.
80
PUBLIC
SAP HANA Troubleshooting and Performance Analysis Guide
Root Causes and Solutions

• Note that the value dened for this parameter also applies to the workload class property
STATEMENT_MEMORY_LIMIT.
4. total_statement_memory_limit - a value in gigabytes to dene the maximum memory available to all
statements running on the system. The default value is 0 (no limit).
• This limit does not apply to users with the administrator role SESSION ADMIN or WORKLOAD ADMIN
who need unrestricted access to the system. However, a check of the user's privileges allowing the
administrator to by-pass the limit is only made for the rst request when a connection is made. The
privileged user would have to reconnect to be able to bypass the statement memory limit again (see
also Admission Control).
• The value dened for this parameter cannot be overridden by the corresponding workload class
property TOTAL_STATEMENT_MEMORY_LIMIT.
• There is a corresponding parameter for use with system replication on an Active/Active (read enabled)
secondary server. This is required to ensure that enough memory is always available for essential log
shipping activity. See also sr_total_statement_memory_limit in section Memory Management.
5. User parameters can limit memory for statements. For further information, refer to Setting User
Parameters for Workload.
Results
The following example and scenarios show the eect of applying these settings:
Example showing statement memory parameters
Parameter
Value
Physical memory 128 GB
global_allocation_limit
The unit used by this parameter is MB. The default value is: 90% of the
rst 64 GB of available physical memory on the host plus 97% of each
further GB; or, in the case of small physical memory, physical memory
minus 1 GB.
statement_memory_limit
1 GB (the unit used by this parameter is GB.)
statement_memory_limit_threshold
60%
Scenario 1:
A statement allocates 2GB of memory and the current used memory size in SAP HANA is 50GB.
• 0,9 * 128GB = 115,2 (global allocation limit)
• 0,6 * 115,2 = 69,12 (threshold in GB)
• 50 GB < 69,12 GB (threshold not reached)
The statement is executed, even though it exceeds the 1GB statement_memory_limit.
Scenario 2:
A statement allocates 2GB and the current used memory size in SAP HANA is 70GB
• 70 GB > 69,12 GB (threshold is exceeded)
SAP HANA Troubleshooting and Performance Analysis Guide
Root Causes and Solutions
PUBLIC 81
The statement is cancelled, as the threshold is exceeded, the statement_memory_limit is applied.
Related Information
Change the Global Memory Allocation Limit
Memory Management
Setting User Parameters for Workload
Managing Peak Load (Admission Control)
3.2 CPU Related Root Causes and Solutions
This section covers the troubleshooting of high CPU consumption on the system.
A constantly high CPU consumption will lead to a considerably slower system as no more requests can be
processed. From an end user perspective, the application behaves slowly, is unresponsive or can even seem to
hang.
Note that a proper CPU utilization is actually desired behavior for SAP HANA, so this should be nothing to
worry about unless the CPU becomes the bottleneck. SAP HANA is optimized to consume all memory and CPU
available. More concretely, the software will parallelize queries as much as possible in order to provide optimal
performance. So if the CPU usage is near 100% for a query execution, it does not always mean there is an
issue. It also does not automatically indicate a performance issue.
3.2.1Indicators of CPU Related Issues
CPU related issues are indicated by alerts issued or in views in the SAP HANA cockpit.
The following alerts may indicate CPU resource problems:
• Host CPU Usage (Alert 5)
• Most recent savepoint operation (Alert 28)
• Savepoint duration (Alert 54)
You notice very high CPU consumption on your SAP HANA database from one of the following:
• Alert 5 (Host CPU Usage) is raised for current or past CPU usage
• The CPU usage displayed in the CPU Usage tile on the Overview screen
• The Performance Monitor shows high current or past CPU consumption. Furthermore, the CPU usage of
the host as well as the individual servers is displayed.
82
PUBLIC
SAP HANA Troubleshooting and Performance Analysis Guide
Root Causes and Solutions
3.2.2Analysis of CPU Related Issues
This section describes how to analyze high CPU consumption using tools in the SAP HANA cockpit and the
command line.
When analyzing high CPU consumption, you need to distinguish between the CPU resources consumed by
HANA itself and by other, non-SAP HANA processes on the host. While the CPU consumption of SAP HANA will
be addressed here in detail, the CPU consumption of other processes running on the same host is not covered.
Such situations are often caused by additional programs running concurrently on the SAP HANA appliance
such as anti-virus and backup software. For more information see SAP Note 1730928 - Using external software
in a HANA appliance.
Analyzing CPU Consumption in Cockpit
A good starting point for the analysis is the Overview page in the SAP HANA cockpit. It contains a tile that
displays CPU usage. If you click on that tile, the Performance Monitor opens and you can view the SAP HANA
CPU usage versus total CPU usage. If SAP HANA CPU usage is low while total CPU usage is high, the issue is
most likely related to a non-SAP HANA process.
To nd out what is happening in more detail, open the Threads tile (see Thread Monitoring). In order to prepare
it for CPU time analysis, perform the following steps:
• To switch on resource tracking open the Conguration of System Properties monitor and in the
resource_tracking section of the global.ini le set the enable_tracking parameter to on. See
Memory Information from Logs and Traces.
• Display the CPU Time column in the Thread Monitor.
The Thread Monitor shows the CPU time of each thread running in SAP HANA in microseconds. A high CPU
time of related threads is an indicator that an operation is causing the increased CPU consumption.
In order to identify expensive statements causing high resource consumption, turn on the Expensive Statement
Trace and specify a reasonable runtime (see Expensive Statements Trace). If possible, add further restrictive
criteria such as database user or application user to narrow down the amount of information traced. Note that
the CPU time for each statement is shown in the column CPU_TIME if resource_tracking is activated.
General Analysis Resources
The topic 'HANA System-wide Performance Analysis' describes a general approach which can also be applied
for CPU related issues. This includes the following actions:
• Generating a runtime dump
• Creating a kernel proler trace
• Using the HANA Dump Analyzer tool
You can enable and congure the kernel proler in the SAP HANA Database Explorer (Trace Conguration) or
you can manage the kernel proler from the SQL command line using the ALTER SYSTEM command. In both
cases RESOURCE ADMIN or TRACE ADMIN privileges are required. Note that setting a maximum duration or
SAP HANA Troubleshooting and Performance Analysis Guide
Root Causes and Solutions
PUBLIC 83

memory limit for proling is good practice and should be used if appropriate values can be estimated. More
information about this tool can be found in Kernel Proler.
In addition to the runtime dump it may be possible to capture the current state of the system in a full system
information dump for later analysis. However, this in itself requires resources and may therefore worsen the
situation. To get a Full System Info Dump using SAP HANA cockpit, open Diagnosis Files via the link Manage
full system information dumps under Alerting & Diagnostics and choose either a zip le from the list or create a
new one via Collect Diagnostics. See also the topic 'Diagnosis Information' in the Tools and Tracing section.
Tip
Guided Answers is a support tool for troubleshooting problems using decision trees. A guided answer is
available for How to troubleshoot HANA High CPU Utilization.
Related Information
SAP Note 1730928
Thread Monitoring
Memory Information from Logs and Traces [page 66]
Expensive Statements Trace [page 243]
HANA System-wide Performance Analysis [page 46]
Kernel Proler [page 290]
Collect and Download Diagnosis Information
Diagnosis Information [page 292]
How to troubleshoot HANA High CPU Utilization (Guided Answer)
3.2.3Resolving CPU Related Issues
The rst priority in resolving CPU related issues is to return the system to a normal operating state, which may
complicate identifying the root cause.
Immediate Remedial Action
Issue resolution should aim to bring the system back to a functional state by stopping the operation that
causes the high CPU consumption. However, after resolving the situation it might not be possible to nd out
the actual root cause, you should therefore consider recording a HANA Runtime Dump before taking any
countermeasures. See SAP Note 1813020 How to generate a runtime dump on SAP HANA and Analysis of CPU
Related Issues.
You can identify and stop the specic operation causing high CPU consumption using the Threads Monitor in
SAP HANA Cockpit (see Thread Monitoring). Use the values in the columns Client Host, Client IP, Client PID
84
PUBLIC
SAP HANA Troubleshooting and Performance Analysis Guide
Root Causes and Solutions
and Application User to identify the user that triggered the operation. Contact the user to conrm what actions
are currently being performed and agree on how to resolve the situation; two options are available:
• On the client side, end the process calling the aected threads
• Cancel the operation by selecting the thread in the Threads Monitor and choose Cancel Operation.
For further analysis of the root cause, you may need to open a ticket to SAP HANA Development Support and
attach the Full System Info Dump.
Analysis of the System Conguration
Under normal circumstances when the SAP HANA Database instance is correctly congured, exhaustion
of CPU resources should not occur. Firstly, therefore, verify that the conguration conforms to SAP
recommendations using the script HANA_Conguration_Parameters_2.00.040+ in the SQL Statement
Collection for SAP HANA (attached to SAP Note 1969700). The output of this script will list all parameters
deviating from recommended settings. In this situation pay particular attention to the workload management
related parameters such as default_statement_concurrency_limit as outlined in section 'Controlling Parallel
Execution of SQL Statements'.
Scenario Illustrating Unusual Load Peaks
Even if the workload management related parameters are set as recommended, CPU resources may still be
exhausted by unusual peaks in the workload. Considering the following scenario:
• A system is congured with 144 CPU cores
• The default_statement_concurrency_limit is set to 48 - therefore an application workload may consume
33.3% of the available CPU resources
• An application submits an OLAP workload request to the HANA database (with a higher degree of
parallelism) which, within the foreseen workload management boundaries, requires 33% of the available
resources.
If, however, the application submits 3 such requests via 3 dierent sessions simultaneously this workload may
easily exhaust the CPU resources. This illustrates the importance of nding the right workload management
balance for your individual system; there is no "one-conguration-ts-all” approach and you may therefore
need to change the workload management related conguration parameters to t your own specic
application requirements. In the given scenario, for example, the solution may be to further decrease the
concurrency degree of individual database requests by adjusting default_statement_concurrency_limit to even
lower levels.
Related Information
Analysis of CPU Related Issues [page 83]
Thread Monitoring
Controlling Parallel Execution of SQL Statements [page 87]
SAP HANA Troubleshooting and Performance Analysis Guide
Root Causes and Solutions
PUBLIC 85

SAP Note 1969700 - SAP HANA Statement Collection
SAP Note 1813020 - How to generate a runtime dump on SAP HANA
3.2.4Retrospective Analysis of CPU Related Issues
There are a number of options available to analyze what the root cause of an issue was after it has been
resolved.
A retrospective analysis of high CPU consumption should start by checking the Performance Monitor and the
Alerts tile in SAP HANA cockpit. Using the alert time or the graph in the Performance Monitor, determine the
time frame of the high CPU consumption.
If you are not able to determine the time frame because the issue happened too long ago, check the following
scripts in the SQL Statement Collection for SAP HANA (attached to SAP Note 1969700):
• HANA_LoadHistory_Services_*
• HANA_Resources_CPUAndMemory_History*
Once a problematic time-period is identied you can proceed with thread sample analysis as described in the
section 'Analysis of Former Performance Problems' in HANA System-wide Performance Analysis.
Monitoring Views and Trace Files
You can search through the trace les of the process causing high consumption if you can narrow down the
time period when the event happened. The following views
If you are not able to determine the time frame because the issue happened too long ago, check
the following statistics server table which includes historical host resource information up to 30 days:
HOST_RESOURCE_UTILIZATION_STATISTICS (_SYS_STATISTICS schema). A longer history can be found in
the statistics server table HOST_DELTA_MERGE_STATISTICS.
With this information, search through the trace les of the responsible process. Be careful to choose the
correct host when SAP HANA runs on a scale-out landscape. The information contained in the trace les will
give indications on the threads or queries that were running during the aected time frame.
If the phenomenon is recurrent due to a scheduled batch job or data loading processes, turn on the Expensive
Statement Trace during that time to record all involved statements (see Expensive Statements Trace ).
Furthermore, check for concurrently running background jobs like backups and Delta Merge that may cause
a resource shortage when run in parallel. Historical information about such background jobs can be obtained
from the system views:
• M_BACKUP_CATALOG
• M_DELTA_MERGE_STATISTICS
Related Information
HANA System-wide Performance Analysis [page 46]
86
PUBLIC
SAP HANA Troubleshooting and Performance Analysis Guide
Root Causes and Solutions

The Performance Monitor (SAP HANA Cockpit)
Expensive Statement Trace (SAP HANA Cockpit) [page 243]
Alerts (SAP HANA Cockpit)
SAP Note 1969700
M_BACKUP_CATALOG
M_DELTA_MERGE_STATISTICS
HOST_DELTA_MERGE_STATISTICS
3.2.5Controlling Parallel Execution of SQL Statements
You can apply ini le settings to control the two thread pools SqlExecutor and JobExecutor that control the
parallelism of statement execution.
Caution
The settings described here should only be modied when other tuning techniques like remodeling,
repartitioning, and query tuning have been applied. Modifying the parallelism settings requires a thorough
understanding of the actual workload since they have impact on the overall system behavior. Modify the
settings iteratively by testing each adjustment. For more information, see Understand your Workload.
On systems with highly concurrent workload, too much parallelism of single statements may lead to sub-
optimal performance. Note also that partitioning tables inuences the degree of parallelism for statement
execution; in general, adding partitions tends to increase parallelism. You can use the parameters described in
this section to adjust the CPU utilization in the system.
Two thread pools control the parallelism of the statement execution. Generally, target thread numbers applied
to these pools are soft limits, meaning that additional available threads can be used if necessary and deleted
when no longer required:
• SqlExecutor
This thread pool handles incoming client requests and executes simple statements. For each statement
execution, an SqlExecutor thread from a thread pool processes the statement. For simple OLTP-like
statements against column store as well as for most statements against row store, this will be the only type
of thread involved. With OLTP we mean short running statements that consume relatively little resources,
however, even OLTP-systems like SAP Business Suite may generate complex statements.
• JobExecutor
The JobExecutor is a job dispatching subsystem. Almost all remaining parallel tasks are dispatched to the
JobExecutor and its associated JobWorker threads.
In addition to OLAP workload the JobExecutor also executes operations like table updates, backups,
memory garbage collection, and savepoint writes.
You can set a limit for both SqlExecutor and JobExecutor to dene the maximum number of threads. You can
use this for example on a system where OLAP workload would normally consume too many CPU resources to
apply a maximum value to the JobExecutor to reserve resources for OLTP workload.
Caution
Lowering the value of these parameters can have a drastic eect on the parallel processing of the servers
and reduce the performance of the overall system. Adapt with caution by iteratively making modications
SAP HANA Troubleshooting and Performance Analysis Guide
Root Causes and Solutions
PUBLIC 87

and testing. For more information, see Understand your Workload and SAP Note 2222250 - FAQ SAP HANA
Workload Management which contains more details of the workload conguration parameters.
A further option to manage statement execution is to apply a limit to an individual user prole for all
statements in the current connection using ‘THREADLIMIT’ parameter. This option is described in Setting
User Parameters.
Parameters for SqlExecutor
The following SqlExecutor parameters are in the sql section of the indexserver.ini le.
sql_executors - sets a soft limit on the target number of logical cores for the SqlExecutor pool.
• This parameter sets the target number of threads that are immediately available to accept incoming
requests. Additional threads will be created if needed and deleted if not needed any more.
• The parameter is initially not set (0); the default value is the number of logical cores in a system. As each
thread allocates a particular amount of main memory for the stack, reducing the value of this parameter
can help to avoid memory footprint.
max_sql_executors - sets a hard limit on the maximum number of logical cores that can be used.
• In normal operation new threads are created to handle incoming requests. If a limit is applied here, SAP
HANA will reject new incoming requests with an error message if the limit is exceeded.
• The parameter is initially not set (0) so no limit is applied.
Caution
SAP HANA will not accept new incoming requests if the limit is exceeded. Use this parameter with extreme
care.
Parameters for JobExecutor
The following JobExecutor parameters are in the execution section of the global.ini or
indexserver.ini.
max_concurrency - sets the target number of logical cores for the JobExecutor pool.
• This parameter sets the size of the thread pool used by the JobExecutor used to parallelize execution of
database operations. Additional threads will be created if needed and deleted if not needed any more. You
can use this to limit resources available for JobExecutor threads, thereby saving capacity for SqlExecutors.
• The parameter is initially not set (0); the default value is the number of logical cores in a system. Especially
on systems with at least 8 sockets consider setting this parameter to a reasonable value between the
number of logical cores per CPU up to the overall number of logical cores in the system. In a system that
supports tenant databases, a reasonable value is the number of cores divided by the number of tenant
databases.
max_concurrency_hint - limits the number of logical cores for job workers even if more active job workers
would be available.
88
PUBLIC
SAP HANA Troubleshooting and Performance Analysis Guide
Root Causes and Solutions

• This parameter denes the number of jobs to create for an individual parallelized operation. The
JobExecutor proposes the number of jobs to create for parallel processing based on the recent load on
the system. Multiple parallelization steps may result in far more jobs being created for a statement (and
hence higher concurrency) than this parameter.
• The default is 0 (no limit is applied but the hint value is never greater than the value for
max_concurrency). On large systems (that is more than 4 sockets) setting this parameter to the number
of logical cores of one socket may result in better performance but testing is necessary to conrm this.
default_statement_concurrency_limit - restricts the actual degree of parallel execution per connection
within a statement.
• This parameter controls the maximum overall parallelism for a single database request. Set this to a
reasonable value (a number of logical cores) between 1 and max_concurrency but greater or equal to the
value set for max_concurrency_hint.
• The default setting is 0; no limit is applied. Note, however, that a new default value for this parameter may
also be set during installation using the SAP HANA database lifecycle manager (HDBLCM) tool. In this
case, a limit may already be in force. See also SAP Note 3011356 - Default Value of global.ini [execution]
default_statement_concurrency_limit Changed.
Related Information
Understand your Workload
Example Workload Management Scenarios
Setting User Parameters for Workload
SAP Note 2222250
SAP Note 3011356
3.2.6Apply NUMA Node Anity Settings
If the physical hardware on a host is shared between several processes, you can use CPU anity settings to
assign a set of logical cores to a specic SAP HANA process. These settings are coarse-grained and apply on
the OS and process-level.
Prerequisites
You can use the affinity conguration parameter to restrict CPU usage of SAP HANA server processes to
certain CPUs or ranges of CPUs.
Start by analyzing how the system CPUs are congured using the Linux lscpu command and then, based
on the information returned, apply anity settings in daemon.ini to bind specic processes to logical CPU
cores. Processes must be restarted before the changes become eective. This approach applies primarily to
the use cases of SAP HANA tenant databases and multiple SAP HANA instances on one server; you can use
this approach, for example, to partition the CPU resources of the system by tenant database.
SAP HANA Troubleshooting and Performance Analysis Guide
Root Causes and Solutions
PUBLIC 89

To make the changes described here, you require access to the operating system of the SAP HANA instance to
run the lscpu command and you require the privilege INIFILE ADMIN.
Context
For Xen and VMware, the users in the VM guest system see what is congured in the VM host. So, the quality
of the reported information depends on the conguration of the VM guest. Therefore, SAP can’t give any
performance guarantees in this case.
Procedure
1. Firstly, to conrm the physical and logical details of your CPU architecture, analyze the system using
the lscpu command. This command returns a listing of details of the system architecture. The following
table gives a commentary on the most useful values based on an example system with 2 physical chips
(sockets), each containing 8 physical cores. These cores are hyperthreaded to give a total of 32 logical
cores.
# Feature Example Value
1 Architecture x86_64
2 CPU op-modes 32-bit, 64-bit
3 Byte Order LittleEndian
4 CPUs 32
5 On-line CPUs list 0–31
6 Threads per core 2
7 Cores per socket 8
8 Sockets 2
9 NUMA nodes 2
21 NUMA node0 CPUs 0-7,16-23
22 NUMA node1 CPUs 8-15,24-31
• 4–5: This example server has 32 logical cores numbered 0–31
• 6–8: Logical cores ("threads") are assigned to physical cores. Hyperthreading is where multiple
threads are assigned to a single physical core In this example, there are 2 sockets, with each socket
containing 8 physical cores (total 16). Two logical cores (#6) are assigned to each physical core,
thus, each core exposes two execution contexts for the independent and concurrent execution of two
threads.
90
PUBLIC
SAP HANA Troubleshooting and Performance Analysis Guide
Root Causes and Solutions
• 9: In this example there are 2 NUMA nodes, one for each socket. Other systems may have multiple
NUMA nodes per socket.
• 21–22: The 32 logical cores are numbered and assigned to one of the two NUMA nodes.
Note
Even on a system with 32 logical cores and two sockets the assignment of logical cores to physical
CPUs and sockets can be dierent. It’s important to collect the assignment in advance before making
changes. A more detailed analysis is possible using the system commands described in the next step.
These provide detailed information for each core including how CPU cores are grouped as siblings.
2. In addition to the lscpu command, you can use the set of system commands in the /sys/devices/
system/cpu/ directory tree. For each logical core, there is a numbered subdirectory beneath this node
(/cpu12/ in the following examples). The examples show how to retrieve this information and the table
gives details of some of the most useful commands available:
Example
cat /sys/devices/system/cpu/present
cat /sys/devices/system/cpu/cpu12/topology/thread_siblings_list
Command Example Output Commentary
present 0–15 The number of logical cores available for scheduling.
cpu12/topology/core_siblings_list 4–7, 12-15 The cores on the same socket.
cpu12/topology/thread_siblings_list 4, 12 The logical cores assigned to the same physical core
(hyperthreading).
cpu12/topology/physical_package_id 1 The socket of the current core - in this case cpu12.
Other Linux commands that are relevant here are sched_setaffinity and numactl.
sched_setaffinity limits the set of CPU cores available (by applying a CPU anity mask) for execution
of a specic process (this can be used, for example, to isolate tenants) and numactl controls NUMA policy
for processes or shared memory.
3. Based on the results returned you can use the affinity setting to restrict CPU usage of SAP HANA
server processes to certain CPUs or ranges of CPUs. You can set restrictions for the following servers:
nameserver, indexserver, compileserver, preprocessor, and xsengine (each server has a section in the
daemon.ini le). The anity setting is applied by the TrexDaemon when it starts the other HANA processes
using the command sched_setaffinity. Changes to the anity settings take eect only after restarting
the HANA process. The following examples and commentary show the syntax for the ALTER SYSTEM
CONFIGURATION commands required.
SAP HANA Troubleshooting and Performance Analysis Guide
Root Causes and Solutions
PUBLIC 91

Example
To restrict the nameserver to two logical cores of the rst CPU of socket 0 (see line 21 in the previous
example), use the following anity setting:
ALTER SYSTEM ALTER CONFIGURATION ('daemon.ini', 'SYSTEM') SET
('nameserver', 'affinity') = '0,16'
Example
To restrict the preprocessor and the compileserver to all remaining cores (that is, all except 0 and 16)
on socket 0 (see line 21 in the previous example), use the following anity settings:
ALTER SYSTEM ALTER CONFIGURATION ('daemon.ini', 'SYSTEM') SET
('preprocessor', 'affinity') = '1-7,17-23'
ALTER SYSTEM ALTER CONFIGURATION ('daemon.ini', 'SYSTEM') SET
('compileserver', 'affinity') = '1-7,17-23'
Example
To restrict the indexserver to all cores on socket 1 (see line 22 in the previous example), use the
following anity settings:
ALTER SYSTEM ALTER CONFIGURATION ('daemon.ini', 'SYSTEM') SET
('indexserver', 'affinity') = '8-15,24-31'
4. You can assign anities to dierent tenants of a multi-tenant database on the same host as shown here.
Run these SQL statements on the SYSTEMDB.
Example
In this scenario tenant NM1 already exists, here we add another tenant NM2:
CREATE DATABASE NM2 ADD AT LOCATION 'host:30040' SYSTEM USER PASSWORD
Manager1;
Set the conguration parameter to bind CPUs to specic NUMA nodes on each tenant. You can use the
following notation with a dot to identify the specic tenant:
ALTER SYSTEM ALTER CONFIGURATION ('daemon.ini','SYSTEM') SET
('indexserver.NM1', 'affinity') ='0-7,16-23';
ALTER SYSTEM ALTER CONFIGURATION ('daemon.ini','SYSTEM') SET
('indexserver.NM2', 'affinity') ='8-15,24-31';
5. To assign anities to multiple indexservers of the same tenant on the same host, execute the following
SQL statements on the SYSTEMDB to apply the instance_affinity[port] conguration parameter:
Example
In this scenario, an indexserver is already running on tenant NM1 on port 30003. Here we add another
indexserver on a dierent port:
ALTER DATABASE NM1 ADD 'indexserver' AT LOCATION 'host:30040';
92
PUBLIC
SAP HANA Troubleshooting and Performance Analysis Guide
Root Causes and Solutions
Set the dierent instances of the instance_affinity[port] conguration parameter to bind CPUs
to specic NUMA nodes on each indexserver. The conguration parameter has a 1–2 digit sux to
identify the nal signicant digits of the port number, in this example 30003 and 30040:
ALTER SYSTEM ALTER CONFIGURATION ('daemon.ini','SYSTEM') SET
('indexserver.NM1', 'instance_affinity[3]')='0-7,16-23';
ALTER SYSTEM ALTER CONFIGURATION ('daemon.ini','SYSTEM') SET
('indexserver.NM1', 'instance_affinity[40]')='8-15,24-31';
Restart the indexserver processes to make the anity settings eective.
6. You can test the settings either in SQL or using hdbcons as shown here:
Run this query on the tenant or SystemDB:
select * from M_NUMA_NODES;
Using hdbcons the process ID of the indexserver process is required as a parameter:
hdbcons -p <PID> "jexec info"
Related Information
Memory and CPU Usage for Tenant Databases
SAP HANA Monitoring Views for CPU Topology Details
SQL Statements to Apply NUMA Location Preferences
SAP Note 2470289
3.2.7Basic NUMA Analysis
In this section we present a basic workow for analyzing performance issues, especially on large scale-up
systems running SAP HANA.
Introduction
Server machines with many CPU cores which are packed in multiple sockets today follow a Non-Uniform
Memory Architecture (NUMA). A NUMA node comprises the CPU cores that access a set of DRAM DIMMs via a
memory controller as a NUMA node. In most systems a NUMA node and a socket refer to the same packaging
of these hardware components, see SAP Notes 2470289 and 2632231. Hence, the access to some physical
memory address can be to locally attached DRAM DIMMs or DRAM DIMMs attached to another NUMA node.
While the hardware hides the complexities of accessing the memory attached to dierent NUMA nodes, it may
still result in dierent (that is, non-uniform) bandwidth and latency when accessing some memory address.
When SAP HANA is deployed on systems with many NUMA nodes an analysis of the NUMA eects for a given
workload may be needed. This topic explains the basic steps for collecting information required for identifying
SAP HANA Troubleshooting and Performance Analysis Guide
Root Causes and Solutions
PUBLIC 93

NUMA-related problems. This will be the typical information requested by the SAP HANA quality team when
NUMA-related problems are suspected. This topic focuses on the SAP HANA Cockpit as the administration
interface because it should be available to every SAP HANA customer. A more detailed analysis may be
possible when access to the operating system is available (see also the topic 'Memory Information from Other
Tools').
This analysis has the following three sections:
• Collect System Information
• Examine the Workload
• Tuning for Better NUMA Behavior
The analysis should be complemented by a general analysis of performance problems; see related topics in the
SAP HANA Performance Guide for Developers.
Related Information
Indicators of CPU Related Issues [page 82]
Statement Performance Analysis [page 180]
Memory Information from Other Tools [page 73]
SAP HANA Performance Guide for Developers
SAP Note 2470289
SAP Note 2632231
3.2.7.1 Collect System Information
The initial step is to collect information about the system and its topology.
Basic system information may be needed to identify available features in SAP HANA. In the SAP HANA
Cockpit, the tile Database Information provides the initial information. This information is also accessible via
the view (or public synonym) M_HOST_INFORMATION.
94
PUBLIC
SAP HANA Troubleshooting and Performance Analysis Guide
Root Causes and Solutions
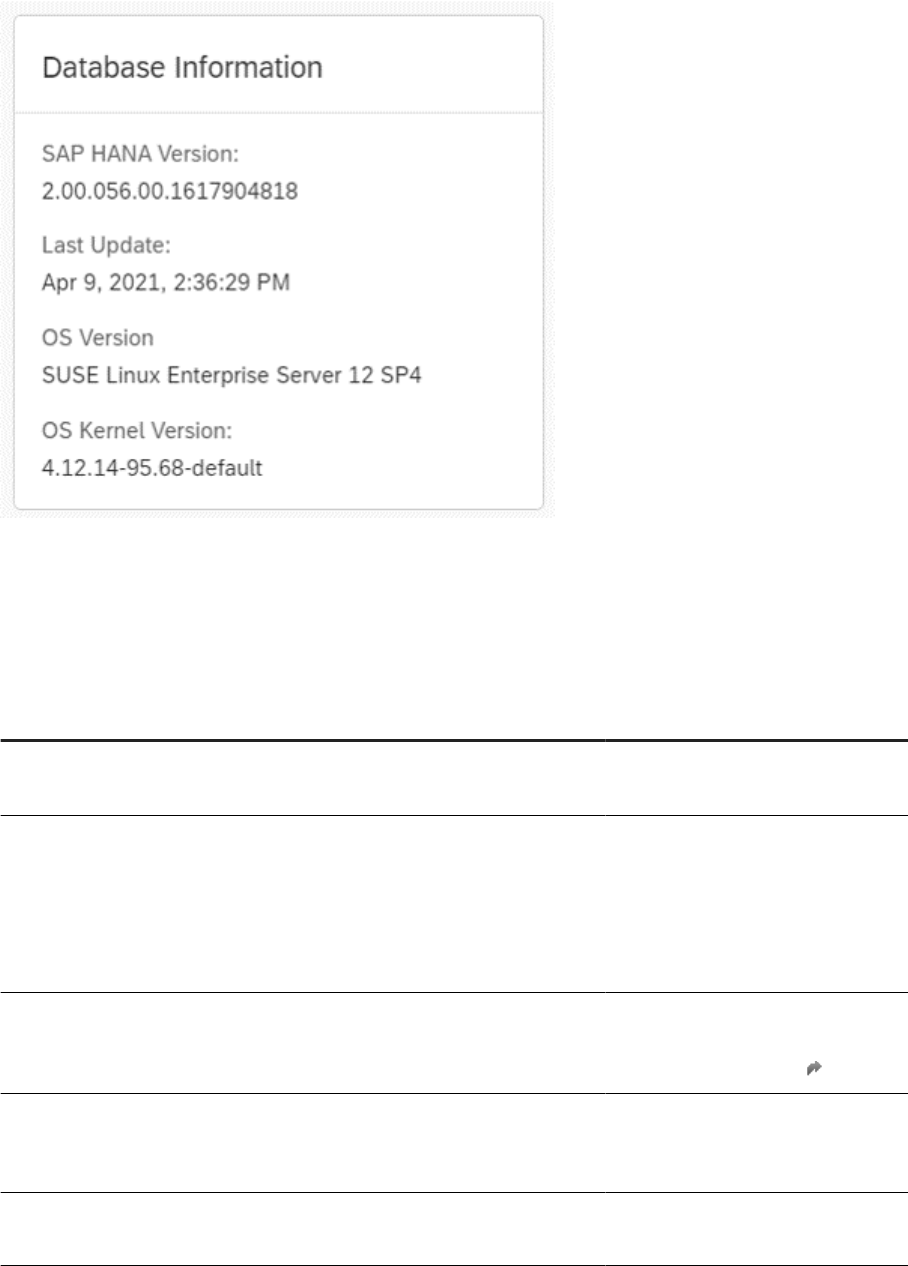
The example system shown here uses SAP HANA version HANA2, Rev 56 using SUSE Linux Enterprise Server
12 SP4 as operating system version (using Linux kernel 4.12.14-95.68-default).
The next step is to collect system topology information using the SAP HANA Database Explorer. The view
M_HOST_INFORMATION delivers relevant information on the system topology. In this example, the system is
equipped as below:
Key
Value Explanation
cpu_cores 88 The number of physical CPUs in the
system.
cpu_threads 176 The number of logical CPU
cores. Consequently, there are 2
hyperthreads per physical core on
this system. Note on the IBM Power
platform there can be up to 8
hyperthreads.
cpu_model
Intel Xeon Gold 6152 CPU Refer to hardware vendors' internet
sites for specic details, for example:
Intel Xeon Gold 6152 CPU
mem_phys 405394542592 This corresponds to approximately
400GB DRAM physically available on
the system.
os_name SUSE Linux Enterprise 12 SP04 The operating system used on this
host. Refer to the internet sites of
SAP HANA Troubleshooting and Performance Analysis Guide
Root Causes and Solutions
PUBLIC 95
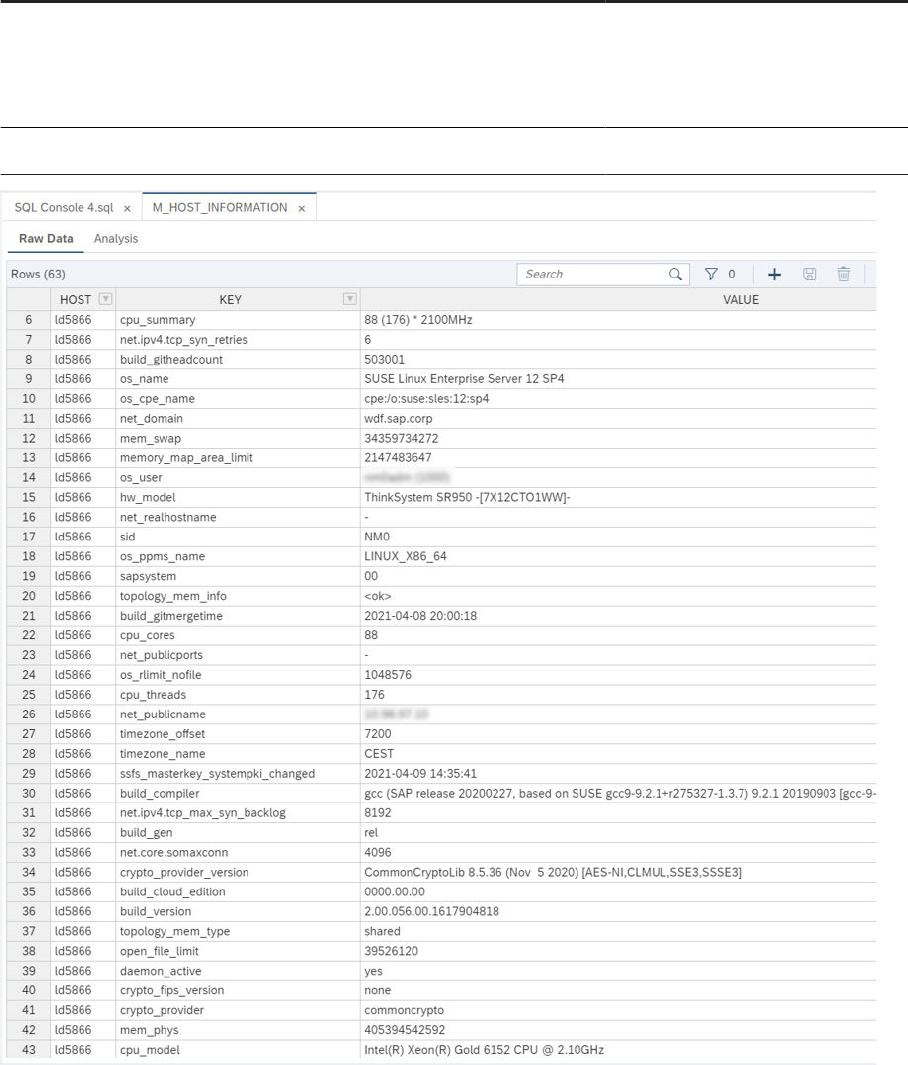
Key Value Explanation
operating system vendors for more
specic details and to the SAP Note
2235581 - SAP HANA: Supported
Operating Systems.
build_version 2.00.056.00.1617904818 This is HANA 2, Rev 56.
To understand the NUMA topology in more detail, the monitoring views NUMA_NODES and
NUMA_RESOURCES are available. SAP Note 2470289 mentions further options to analyze the NUMA topology
and memory usage.
Monitoring Views NUMA_RESOURCES
96
PUBLIC
SAP HANA Troubleshooting and Performance Analysis Guide
Root Causes and Solutions
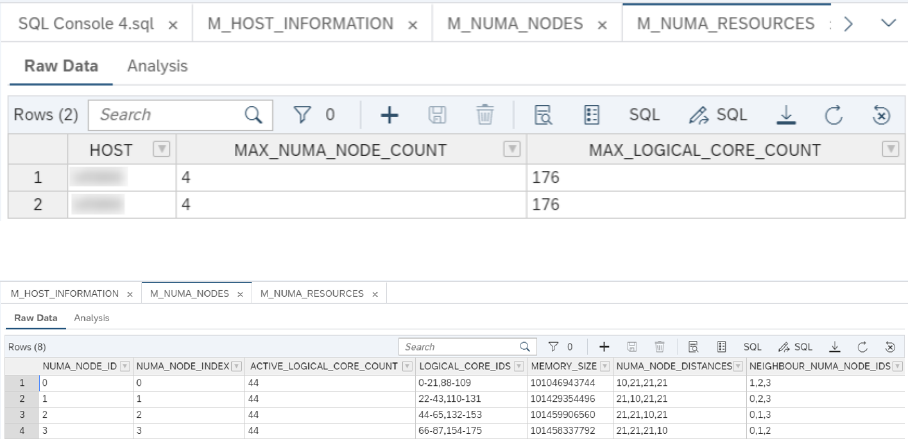
Monitoring View NUMA_NODES
From these views one can learn that the system has four NUMA nodes with NUMA_NODE_IDs 0, 1 2 and
3. Every NUMA node has 44 logical cores, and as every physical core has two hyperthreads every NUMA
node has 22 physical cores. The system memory is evenly distributed across these four NUMA nodes
with 100GB of DRAM attached to every NUMA node. From M_NUMA_NODES.NUMA_NODE_DISTANCES or
M_NUMA_NODES.NEIGHBOUR_NUMA_NODE_IDs one can reconstruct the NUMA node topology, that is how
the cores of every NUMA node can communicate with other NUMA nodes to fetch data from another NUMA
node or for work stealing.
As illustrated below, in this system every NUMA node has all the other NUMA nodes as neighbors, that is fully
meshed via the blue connections between the NUMA nodes.
SAP HANA Troubleshooting and Performance Analysis Guide
Root Causes and Solutions
PUBLIC 97
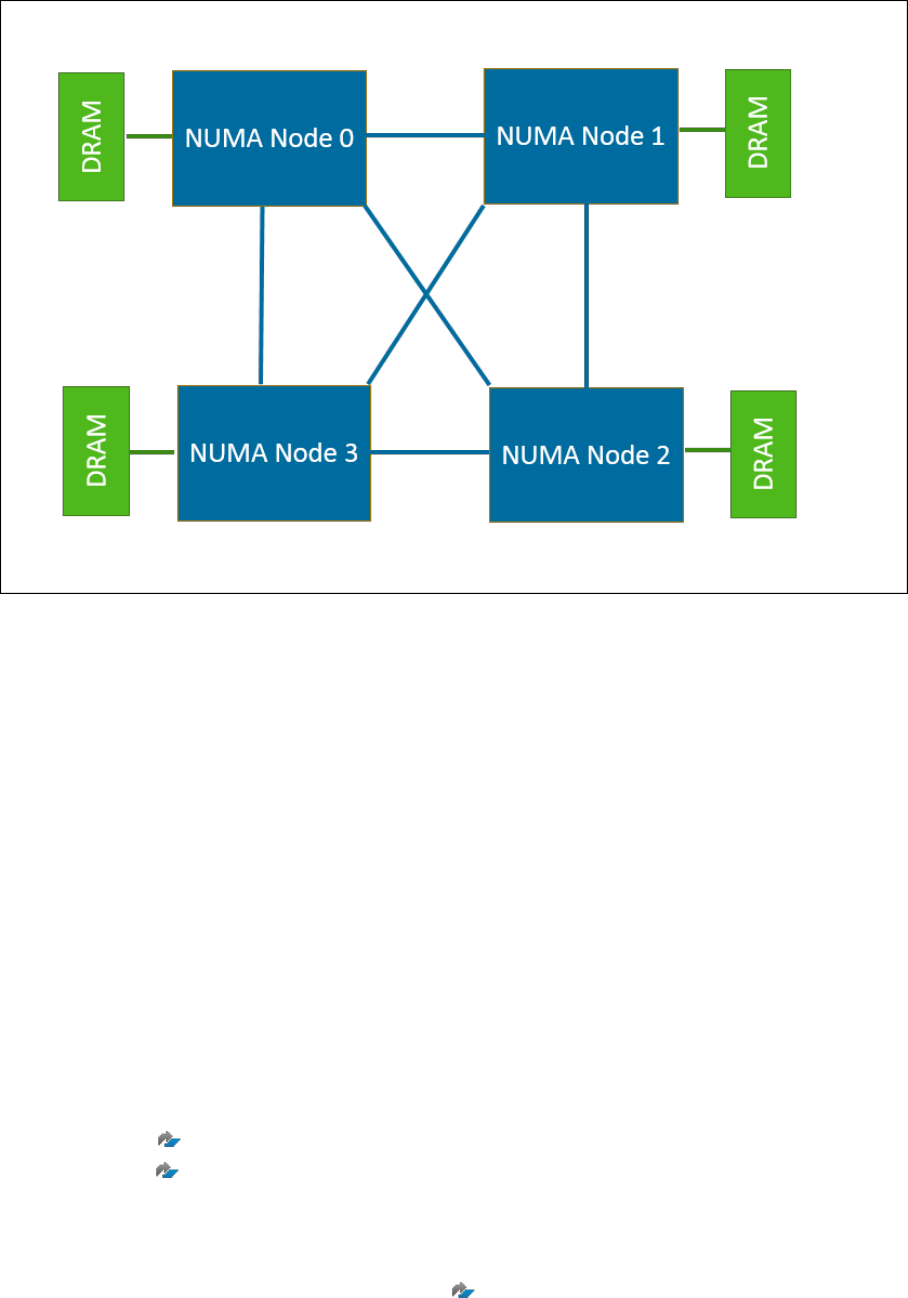
The system used in this analysis likely does not have strong NUMA eects because all NUMA nodes are
directly connected with each other. When memory of one NUMA node can only be reached via multiple hops
in the NUMA topology, we can expect a stronger NUMA eect. This is the case when certain NUMA nodes
are not listed as neighbors of some NUMA node in view M_NUMA_NODES. Furthermore, systems with many
NUMA nodes may require a dedicated "NUMA node controller” to connect islands of NUMA nodes which are
connected with fast UPI links (as in the example above). This information is provided by the hardware partner
or from the system specication.
It is important to analyze performance issues related to the system setup before proceeding with the analysis
of the workload. Refer to the sections in this SAP HANA Troubleshooting and Performance Analysis Guide and
SAP Notes for a starting point. The SAP HANA hardware partners also oer support in this step.
Related Information
Examine the Workload [page 99]
SAP HANA Administration Guide: SAP HANA Cockpit
Getting Started With the SAP HANA Database Explorer
SAP Note 2470289
SAP Note 2235581
M_HOST_INFORMATION
M_NUMA_NODES System View
M_NUMA_RESOURCES System View
Certied and Supported SAP HANA Hardware Partners
98
PUBLIC
SAP HANA Troubleshooting and Performance Analysis Guide
Root Causes and Solutions
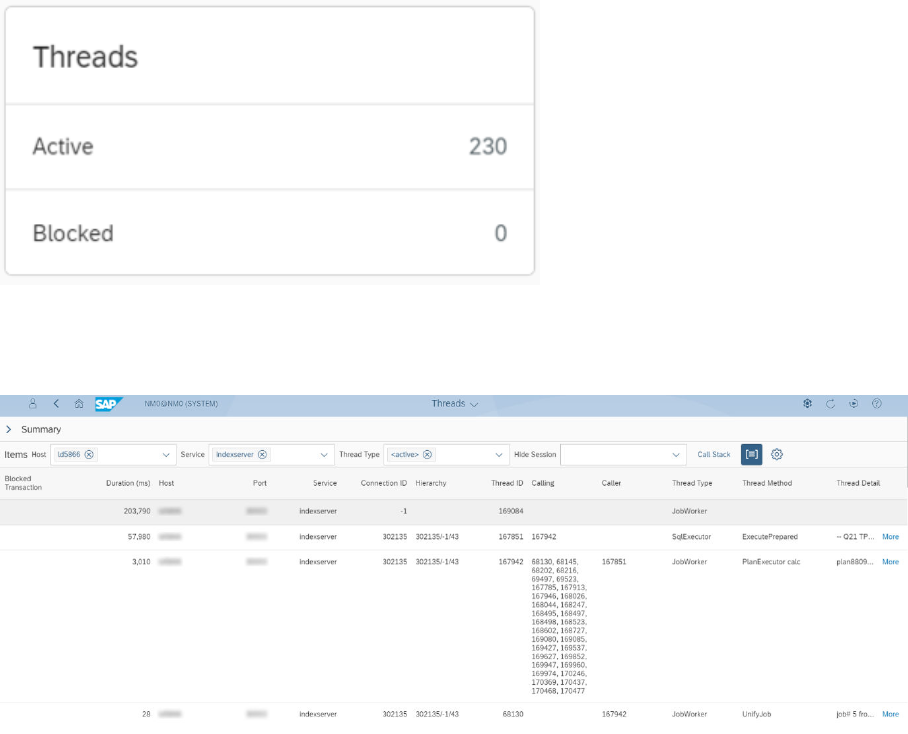
3.2.7.2 Examine the Workload
We can now examine the workload in detail including: CPU utilization, table distribution and the plan cache.
The system information you have collected helps to understand the system behavior given a workload of
interest. For the illustration given here we run the TPC-H workload including updates using scale factor 100 and
40 concurrent streams. You can use this example to help to understand similar NUMA related problems when
examining any customer workload.
For more information on the latest TPC benchmarks (versions two and three) refer to the Transaction
Processing Performance Council web site: http://tpc.org/tpch.
The rst step is to examine the CPU utilization and thread activity. The SAP HANA Cockpit provides the tile
Threads. In the example shown below there are 230 active threads, that is threads scheduled for running on a
CPU core, and no blocked threads. As there are only 176 logical cores on the system, the system’s CPUs are
highly contended.
More information on the thread activity can be found when navigating to the details of the tile as shown below
or by examining the view M_SERVICE_THREADS. In this example it is evident that the thread with id 167942
calls many other threads, that is, the operations are heavily parallelized.
Further general information on the system’s resource utilization can be gathered from the SAP HANA Cockpit
Performance Monitor. It conrms the high CPU utilization close to 99%. The number of active threads and
active SQL Executors conrm the large number of concurrently active threads.
SAP HANA Troubleshooting and Performance Analysis Guide
Root Causes and Solutions
PUBLIC 99
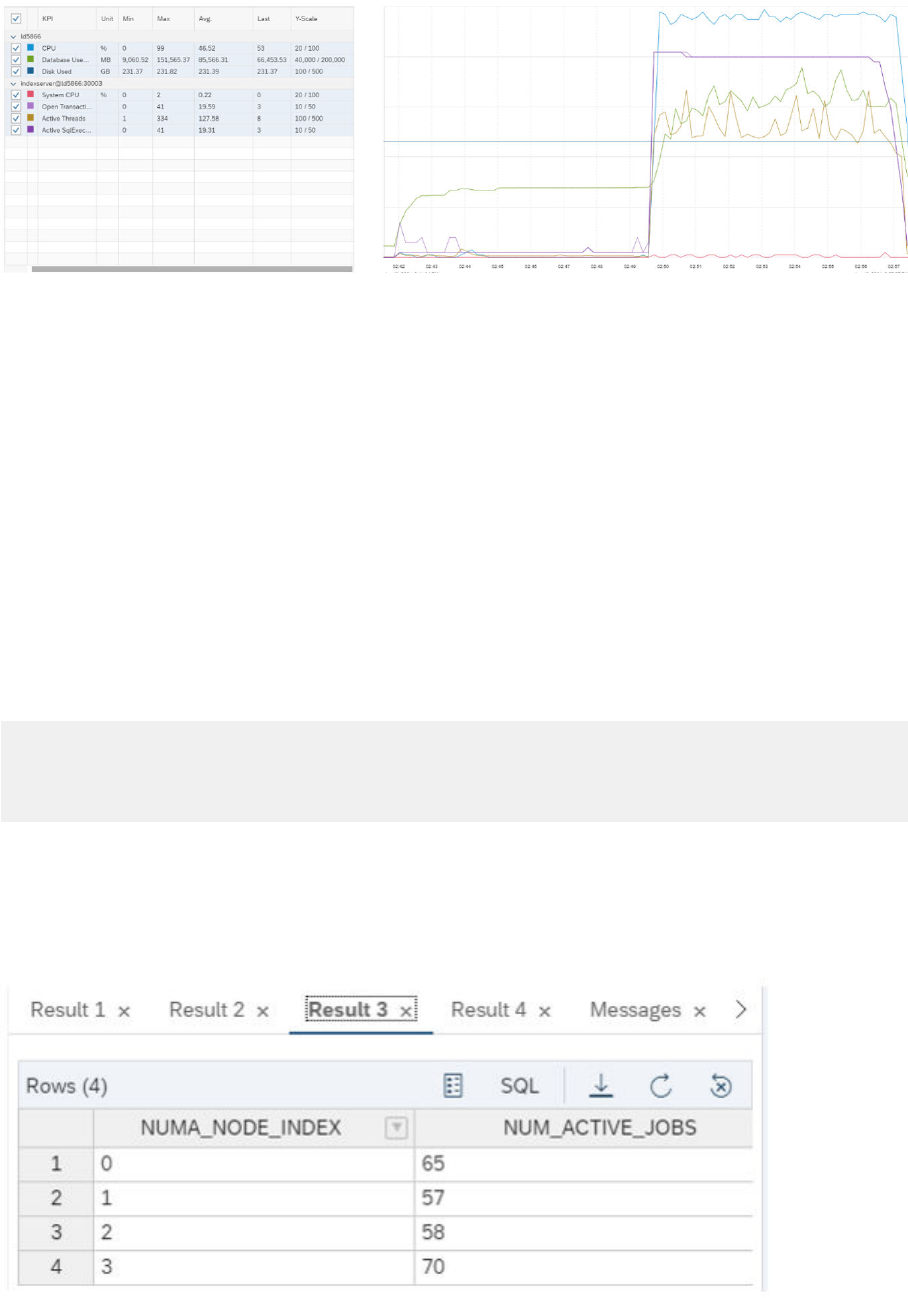
In the above diagram the test rst loads the input data with relatively low CPU resource consumption - up
to the middle of the graph, and the query and update workload is then executed with high CPU resource
consumption.
The view M_JOBEXECUTORS can provide some system-wide indication on CPU-related contention while being
monitored during the runtime of the workload. The column FREE_WORKER_COUNT indicates if newly arriving
work can be handled by free available worker threads. In this workload the FREE_WORKER_COUNT was
mostly at zero which is consistent with the high CPU utilization from the performance monitor. High values of
SYS_WAITING_JOB_COUNT and JOB_WAITING_JOB_COUNT can be caused by jobs waiting for other jobs to
nish, for example due to high CPU utilization, or it could be related to general lock contention. High values
in the QUEUED_WAITING_JOB_COUNT can be related to high CPU load resulting in jobs being queued for
execution when job workers become available to process these jobs.
To drill down further into this analysis, the following statement can be used to detect NUMA nodes with high
CPU utilization by counting the number of active threads. When at the same time other NUMA nodes keep
having many fewer active threads, it can be an indication of a skewed distribution of load across the NUMA
nodes that should be analyzed in more detail.
select numa_node_index, count(0) num_active_jobs
from sys.m_service_threads
where statement_hash <> '' and is_active = 'TRUE'
group by numa_node_index order by numa_node_index;
With 44 logical cores per NUMA node in this system the results below indicate that NUMA node 3 has
signicantly more active threads than the other NUMA nodes. Still, all NUMA nodes seem to be highly utilized
with more than 44 active threads per NUMA node. It should be noted that the fully meshed topology of NUMA
nodes of this system allows for exible stealing of jobs from highly utilized NUMA nodes. A highly skewed work
distribution can be an indication of NUMA node contention.
100
PUBLIC
SAP HANA Troubleshooting and Performance Analysis Guide
Root Causes and Solutions
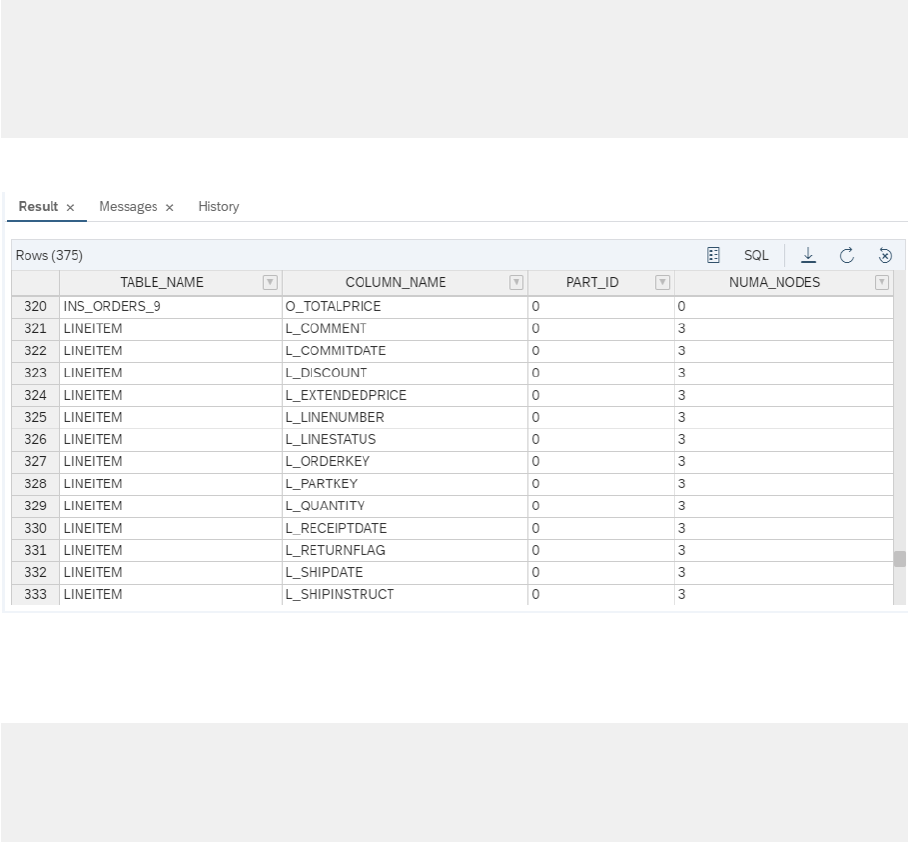
The SAP HANA kernel proler can be used to collect information about which code causes high CPU
consumption. It requires expert knowledge of the SAP HANA code. Additionally, the les generated by the
kernel proler contain system-level statistics on the memory allocation of the system.
Complementing the analysis of CPU utilization and thread activity, we also analyze the table distribution
across NUMA nodes. In general SAP HANA will try to evenly distribute tables or table partitions across the
NUMA nodes in the system. However, multiple hot tables may be allocated to the same NUMA node, and this
may result in high contention accessing this data only on this NUMA node. At the same time other NUMA
nodes can have low or no load, which might lead to a low overall system usage.
For this analysis we execute the following query in the SQL Console of the SAP HANA Database Explorer to get
an overview of the tables and table partitions and how their columns are assigned to NUMA nodes.
select table_name, column_name, part_id,
string_agg(numa_node_index, ',') as numa_nodes
from m_cs_columns
where schema_name like '%TPC%'and numa_node_index >= 0
group by table_name, column_name, part_id
order by table_name, column_name, part_id;
In our example we see that the columns of the largest table, LINEITEM, are all allocated on NUMA node 3.
Furthermore, the following query reports how much memory the columns of all column tables in the system
consume per NUMA node. Adding the value for <persistent_memory_size_in_total> also includes
tempfs and non-volatile memory:
select numa_node_index,
sum(memory_size_in_total+persistent_memory_size_in_total) as
memory_consumption_per_numa_node_in_bytes
from m_cs_columns
group by numa_node_index;
The result of this query is shown below where the rst column is the NUMA node index and the second column
the number of bytes consumed by column store tables on that NUMA node. On NUMA node 3 almost 17GB
of memory are allocated for column tables, while on NUMA nodes 0 and 2 only roughly 8.5GB of memory are
allocated. Also, on NUMA node 2 only 967MB of memory are allocated, that is much less than for the other
NUMA nodes. A negative value for NUMA_NODE_INDEX (for example -1) has a technical interpretation that the
target column is not loaded into memory.
SAP HANA Troubleshooting and Performance Analysis Guide
Root Causes and Solutions
PUBLIC 101
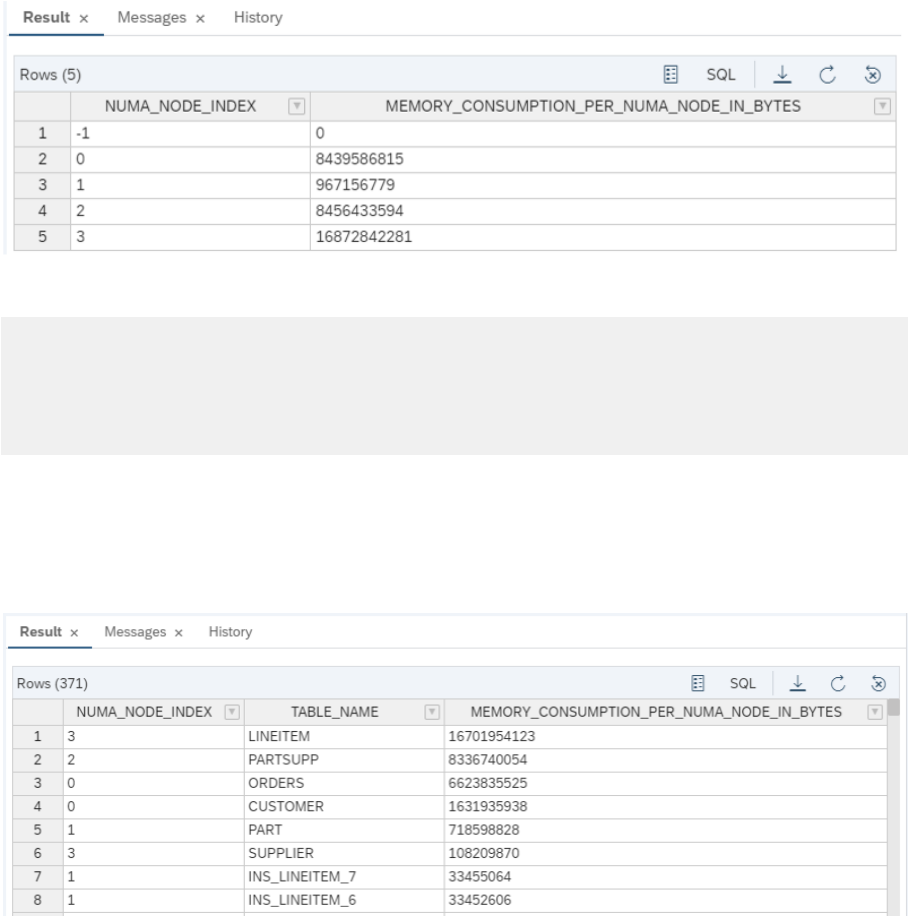
The following query includes the table name and gives more insight:
select numa_node_index, table_name, sum(memory_size_in_total +
persistent_memory_size_in_total)
as memory_consumption_per_numa_node_in_bytes
from m_cs_columns
group by numa_node_index, table_name
order by memory_consumption_per_numa_node_in_bytes desc;
This result further explains why NUMA node 1 has much less memory allocated than the other NUMA nodes:
among the six largest tables only table PART is allocated on that NUMA node. In addition to table data, memory
allocation and de-allocation for transient objects can also be a source of contention or skewed memory
allocation across NUMA nodes which can be analyzed with advanced proling tools, for example Intel PCM,
Intel VTune, or the SAP HANA kernel proler.
A nal important step of the initial analysis is to check the SQL Plan Cache. In the SAP HANA Cockpit one can
navigate to the monitoring of Statements and from there to the analysis of the SQL Plan Cache which shows the
content of view M_SQL_PLAN_CACHE. When sorting the content of the SQL plan cache by the total execution
time in descending order, one can get the statements with the highest contribution to CPU consumption in the
system. It is probable that these statements are the most performance-critical statements because they are
executed with very high frequency or every single statement execution is very expensive. The accessed tables
102
PUBLIC
SAP HANA Troubleshooting and Performance Analysis Guide
Root Causes and Solutions
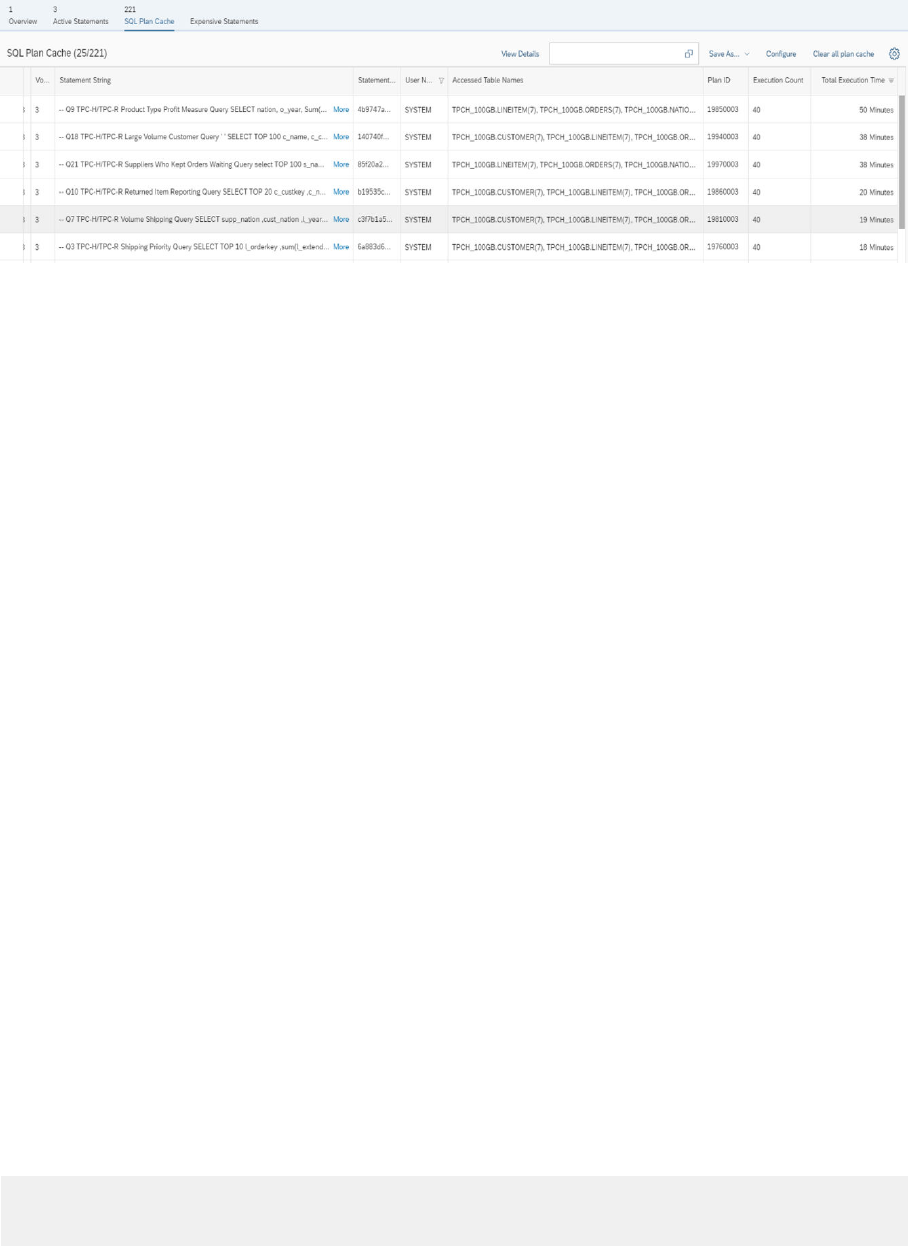
are also available from the SQL plan cache. In this example it is evident that table LINEITEM is used in all of the
expensive statements:
It needs to be emphasized, that optimizing the SQL statements is a critical step before further optimizing the
NUMA behavior. It may be the case that optimizing the SQL statements resolves all major performance issues.
The section Statement Performance Analysis in this guide and the SAP Notes mentioned there provide further
information.
Related Information
Tuning for Better NUMA Behavior [page 103]
SAP HANA Cockpit - Threads
SAP HANA Cockpit - The Performance Monitor
SAP HANA Cockpit - Statements
SAP HANA Cockpit - Monitor and Analyze Statements with SQL Plan Cache
M_SERVICE_THREADS System View
M_JOBEXECUTORS System View
M_SQL_PLAN_CACHE System View
Kernel Proler
3.2.7.3 Tuning for Better NUMA Behavior
This section shows the performance benets which can be achieved by partitioning tables.
One option to distribute the contention for memory accesses and potentially also CPU consumption across
more NUMA nodes is to partition tables. By default, SAP HANA would calculate the NUMA node of the rst
partition of a table with a hashing scheme and then distribute subsequent partitions on a round-robin basis
across the NUMA nodes. In this example we consider a (hash-)range partitioning of the two largest tables as
shown below because it is a commonly used partitioning option for TPC-H. As discussed in the FAQ SAP Note
2044468, table partitioning needs to be done with care considering the application characteristics and related
workload.
ALTER TABLE "TPCH_100GB"."LINEITEM"
PARTITION BY HASH (L_ORDERKEY, L_LINENUMBER) PARTITIONS 1,
RANGE (L_SHIPDATE) (PARTITION '1992-01-02' <= VALUES < '1993-01-01',
SAP HANA Troubleshooting and Performance Analysis Guide
Root Causes and Solutions
PUBLIC 103
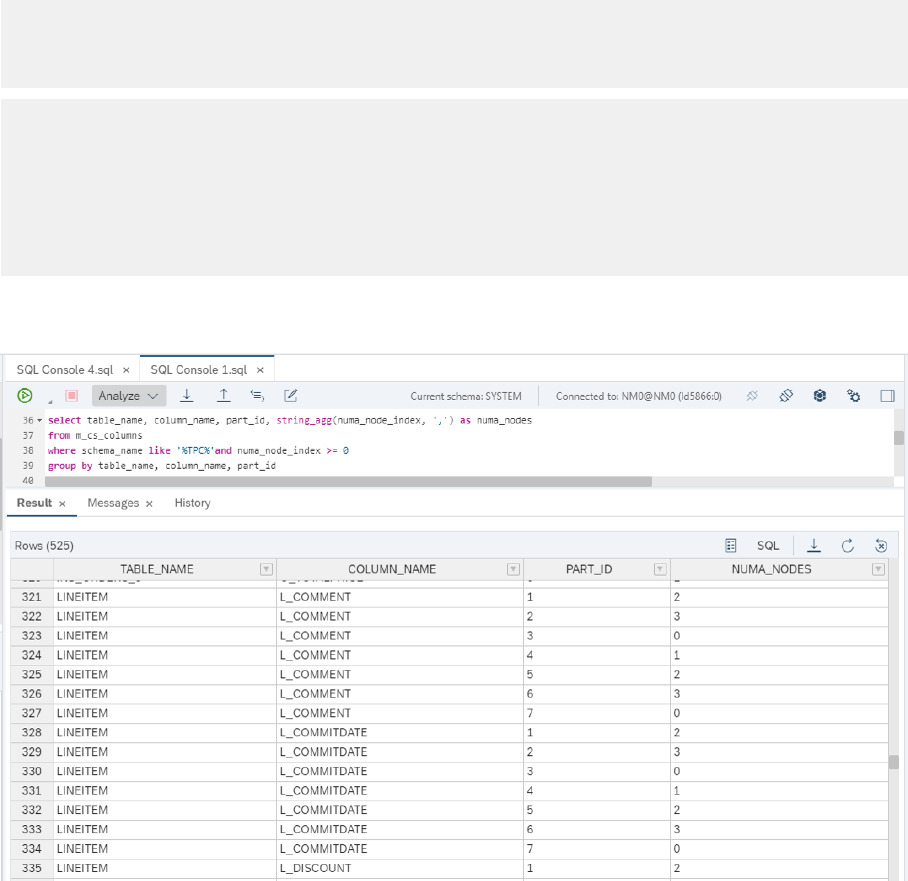
PARTITION '1993-01-02' <= VALUES < '1994-01-01',
…
PARTITION '1997-01-02' <= VALUES < '1998-01-01',
PARTITION OTHERS);
ALTER TABLE "TPCH_100GB"."ORDERS"
PARTITION BY HASH (O_ORDERKEY) PARTITIONS 1,
RANGE (O_ORDERDATE) (PARTITION '1992-01-02' <= VALUES <
'1993-01-01',
PARTITION '1993-01-02' <= VALUES < '1994-01-01',
…
PARTITION '1997-01-02' <= VALUES < '1998-01-01',
PARTITION OTHERS);
From the gure below one can see that all columns of the largest table, LINEITEM, are distributed across all
four NUMA nodes.
Looking at the distribution of memory consumption for the tables across the NUMA nodes it is evident that
NUMA node 3 still has a larger share of data assigned. But overall, one can see a more even distribution of
memory allocations.
104
PUBLIC
SAP HANA Troubleshooting and Performance Analysis Guide
Root Causes and Solutions
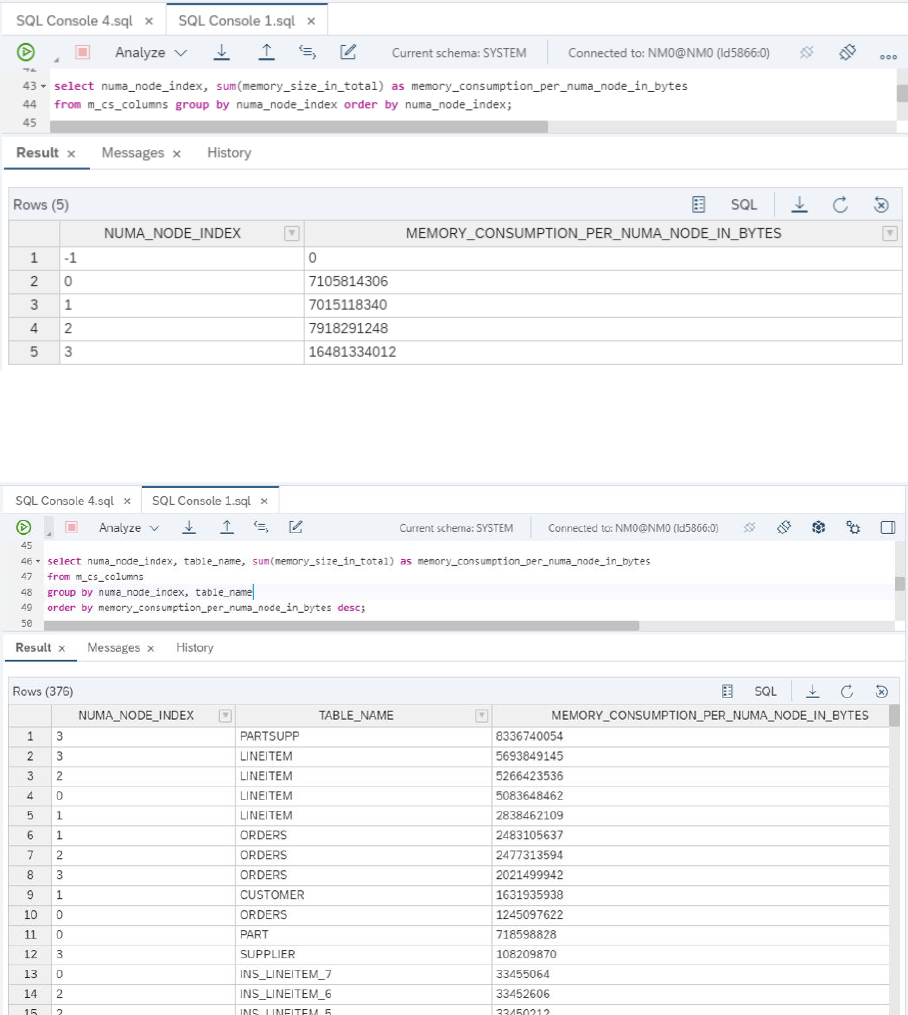
This analysis is conrmed when looking at the largest table partitions and on which NUMA nodes they are
allocated. The report below shows how the tables LINEITEM and ORDERS are now distributed across all NUMA
nodes.
In these exemplary measurements the throughput increased by 3%. At the same time, an increase in the
CPU time (+2.3%) and peak memory (+20%) could be observed. These eects are due to a higher degree of
parallelism when working on the large partitioned tables, and it is also conrmed by looking at the number of
active threads in the performance monitor which shows higher values for the average and maximum number of
active threads and also average CPU consumption.
SAP HANA Troubleshooting and Performance Analysis Guide
Root Causes and Solutions
PUBLIC 105
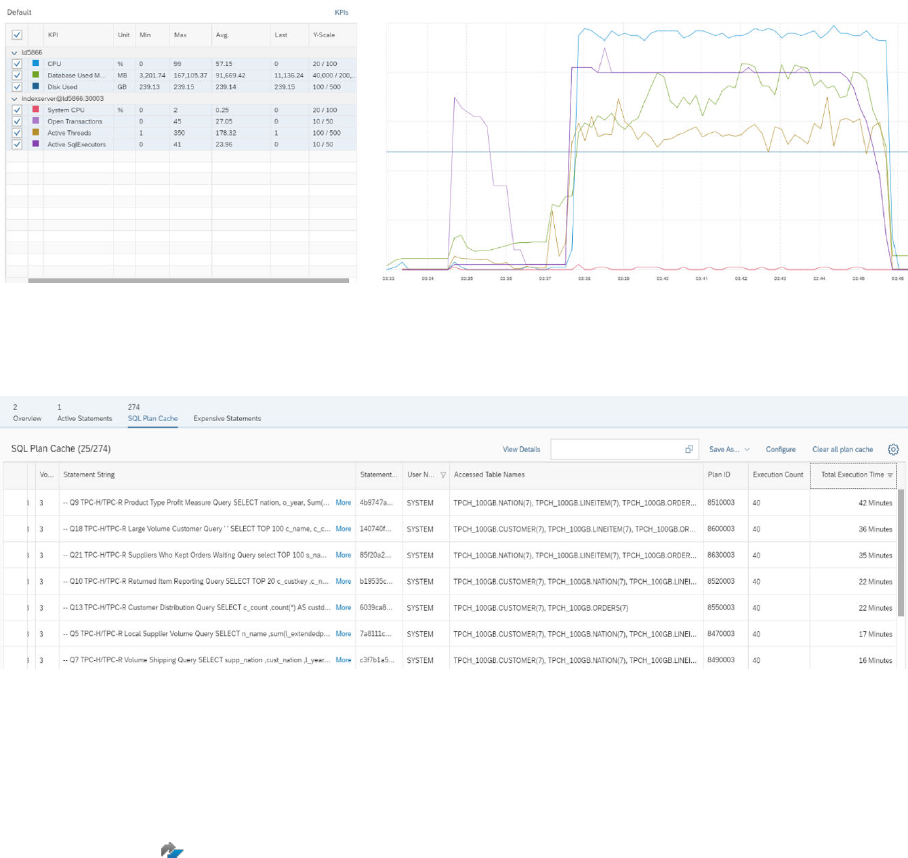
Looking at the SQL plan cache we see that the most expensive query – Q9 – has a reduced total execution
time. However, for Q10 a higher total execution time is reported indicating some trade-os when partitioning
the tables.
Related Information
SAP Note 2044468
3.3 Disk Related Root Causes and Solutions
This section discusses issues related to hard disks and lack of free space.
Low Disk Space
This problem is usually reported by alert 2 which is triggered whenever one of the disk volumes used for data,
log, backup or trace les reaches a critical size.
106
PUBLIC
SAP HANA Troubleshooting and Performance Analysis Guide
Root Causes and Solutions
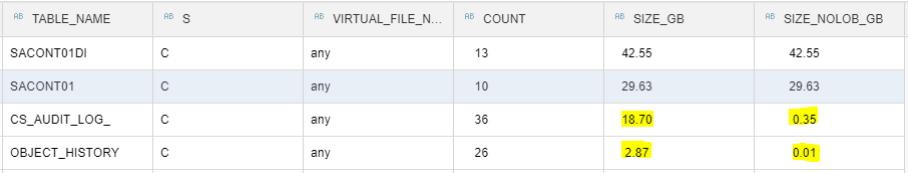
Use the following tools in the SAP HANA cockpit to examine the situation and try to free some disk space:
• Via Alerts tile
• Via Disk Usage tile
• On the Disk Volume Monitor
For high log volume utilizations, refer to SAP KBA 2083715 - Analyzing log volume full situations. For data
volume exhaustions which cannot be explained by the size of the catalog objects (tables etc.) there are a few
more mechanisms which utilize the persistency layer (data volume) such as:
• Disk LOBs
• Table Sizes on Disk
• MVCC Mechanism
• Database Snapshots
The following sections will assist you in analyzing these possible problem areas step by step.
Disk LOBs
Large binary objects are usually not optimally compressible in SAP HANA, thus tables with large LOB les may
also indicate large memory footprints in SAP HANA. Since SAP HANA also oers the concept of hybrid LOBs
(as of SAP HANA SPS07), the majority of the LOB data – larger than a specic threshold - is automatically
outsourced to the physical persistence on disk instead. This can lead to the situation that you have a table
which is small in memory but large on disk level. The SQL statement HANA_Tables_DiskSize_1.00.120+, which
you can nd in the SAP Note 1969700 - SQL Statement Collection for SAP HANA, may provide further insights
on the disk and memory footprint of the largest tables with LOB columns. In the following example, you see
tables which utilize large amounts of disk space but eectively no memory due to the nature of the data itself
(LOBs):
For further information on handling LOBs, refer to:
• SAP Note 2220627 - FAQ: SAP HANA LOBs
• SAP Note 1994962 - How-To: Activation of Hybrid LOBs in SAP HANA
If you cannot narrow down the issue to LOBs, check the virtual le containers on persistency level in more
detail.
SAP HANA Troubleshooting and Performance Analysis Guide
Root Causes and Solutions
PUBLIC 107

Table Sizes on Disk
A rst insight on whether the virtual le containers of the column store tables are responsible for the data
volume utilization can be gained by running the following statement:
SELECT host, port, sum(physical_size) FROM M_TABLE_VIRTUAL_FILES GROUP BY port,
host
This will return the sum of the physical size of all virtual le containers on disk level, representing the total size
of the catalog objects on disk level. If this deviates drastically from the data volume utilization you observe,
there are objects utilizing the data volume other than database tables and indices.
If the sum of the virtual le containers does not match the disk utilization observed on OS level for the data
volume, further checks are necessary.
MVCC Mechanism
A blocked garbage collection may also over-utilize the SAP HANA data volume of the indexserver. Proceed as
outlined in:
• Multiversion Concurrency Control (MVCC) Issues
• SAP KBA 2169283 - FAQ: SAP HANA Garbage Collection
Run the following query to make sure there are no excessive amounts of undo cleanup les:
SELECT SUM(page_count) FROM M_UNDO_CLEANUP_FILES
Undo les contain information needed for transaction rollback and these les are removed when the
transaction completes.
Cleanup les contain deleted information which is kept because of MVCC isolation requirements. When the
transaction completes garbage collection uses the cleanup les to nally remove data.
For more information, refer to M_UNDO_CLEANUP_FILES System View in the SAP HANA SQL and System
Views Reference guide.
Database Snapshots
In specic cases, for example, if data backups have failed in the past, database snapshots for these backups
are not cleaned up. This can be evaluated by the following SQL statements:
SELECT page_sizeclass AS "Page Size-class", page_size*used_block_count/
(1024*1024*1024) AS "Disk Utilization in GB" FROM M_DATA_VOLUME_PAGE_STATISTICS
WHERE volume_id = <volume_id>
108
PUBLIC
SAP HANA Troubleshooting and Performance Analysis Guide
Root Causes and Solutions
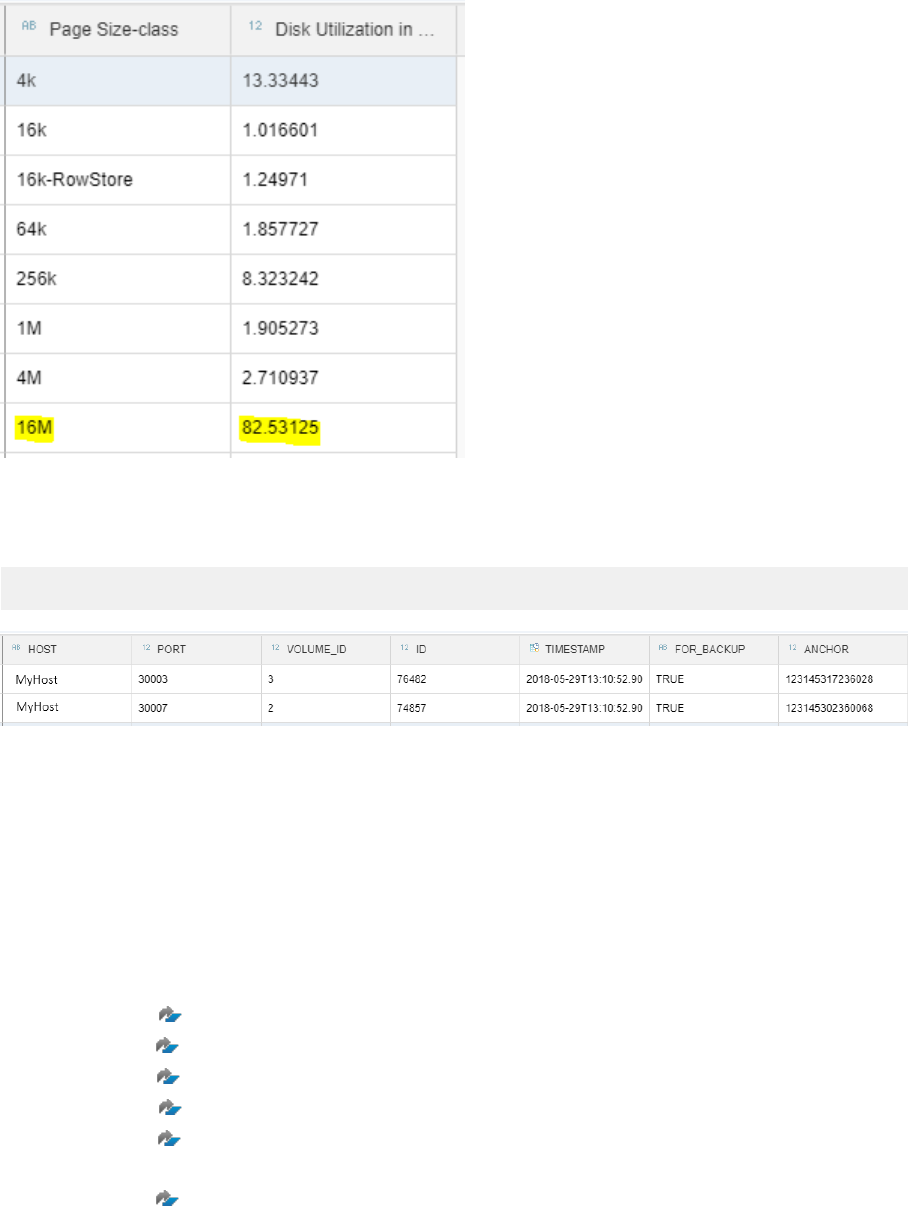
This statement may show a result like:
This leads to the conclusion that the main contributor to the disk utilization are 16MB pages which are mainly
used for the main fragment of the column store. To conrm this, check whether snapshots exist which have
been created for backups:
SELECT * FROM M_SNAPSHOTS
In this case, "dangling" database snapshots which are no longer required should be dropped. This happens
automatically after a database restart.
Related Information
I/O Related Root Causes and Solutions [page 114]
SAP Note 1900643
SAP Note 2083715
SAP Note 1969700
SAP Note 2220627
SAP Note 1994962
Multiversion Concurrency Control (MVCC) Issues [page 175]
SAP Note 2169283
M_UNDO_CLEANUP_FILES System View
SAP HANA Troubleshooting and Performance Analysis Guide
Root Causes and Solutions
PUBLIC 109

3.3.1Reclaiming Disk Space
Defragmentation of data volumes must be carried out as a routine housekeeping operation to recover disk
space or in response to a disk full event.
Automatic Housekeeping in SAP HANA 2.0 SPS 06
A housekeeping job was introduced in SAP HANA 2.0 SPS 06 in the automatic data volume management
process to recover unused space in a data volume caused by fragmentation. The job runs permanently in
the background and becomes active when the measured level of fragmentation overhead on the data volume
reaches 150% and stops when the overhead is reduced to 120%. See also SAP Note 3100336 - What is
fragmentation in context of SAP HANA persistence?.
In previous releases the reclaim process could not handle snapshots which must remain untouched. The
housekeeping process now bypasses snapshots and continues to work through the data volume to the end. If
free space is found data pages are taken from the end of the volume to ll up the free space thus reducing the
total volume.
The feature is enabled by default but in SPS 06 revisions <= 062.00 the full functionality must be
enabled by setting a conguration parameter as described in SAP Note 3198269 - Enable Automatic
Data Volume Reclaim in SAP HANA 2 SPS06. The feature can be disabled by setting parameter
continuous_reclaim_enabled in service.ini (persistence section) to False.
In a replication scenario automatic reclaim can also be run on connected secondary and tertiary sites
by setting the conguration parameter on those systems. It is no longer necessary to run additional
defragmentation processes on those systems.
The following monitoring view showing statistics aggregated over all partitions gives insight into the data
volume reclaim activity: M_DATA_VOLUME_RECLAIM_STATISTICS.
General Information
Reclaiming disk space is necessary because the size allocated to a data le is automatically increased as
more space is required, but it is not automatically decreased when less space is required. This may create a
dierence between allocated size and used size.
For more information on data and log volumes refer to:
• Persistent Data Storage in the SAP HANA Database in the SAP HANA Administration Guide.
• SAP Note 1870858 - HANA Alerts related to le system utilization.
For routine monitoring of disk usage the following scripts from SAP Note 1969700 – SQL Statement
Collection for SAP HANA may be helpful:
• HANA_Disks_Overview
• HANA_Disks_SuperblockStatistics
• HANA_Tables_ColumnStore_TableSize
110
PUBLIC
SAP HANA Troubleshooting and Performance Analysis Guide
Root Causes and Solutions

• HANA_Tables_TopGrowingTables_Size_History
Reclaiming Disk Space Command
The RECLAIM DATAVOLUME statement is described in detail in the SAP HANA SQL and System Views
Reference. The following example illustrates the usage:
alter system reclaim datavolume 'myhost:30003' 120 defragment
The example shows a reasonable payload percentage of 120, that is, an overhead of 20% fragmentation is
acceptable. Smaller payload percentage values can signicantly increase the defragmentation runtime.
The following example lines from the SuperblockStatistics report show a comparison of disk usage before and
after defragmentation:
-------------------------------------------------------------------------------
|HOST |PORT |SB_SIZE_MB|USED_SB_COUNT|TOT_SB_COUNT|USED_GB|ALLOC_GB|FRAG_PCT|
|myhost |30003| 64.00| 8945| 11514| 559| 720| 28.71|
-------------------------------------------------------------------------------
After defragmentation the values for used and allocated disk size are much closer together, the total block
count is reduced and the fragmentation percentage is much lower:
-------------------------------------------------------------------------------
|HOST |PORT |SB_SIZE_MB|USED_SB_COUNT|TOT_SB_COUNT|USED_GB|ALLOC_GB|FRAG_PCT|
|myhost |30003| 64.00| 8146| 8604| 509| 538| 5.62|
-------------------------------------------------------------------------------
Monitoring the Reclaim Process
No monitoring tool is available to check the progress of the RECLAIM command. The following options may be
helpful:
1. Check for savepoint activity to verify that the RECLAIM process is running. This will conrm that
savepoints are consistently being written:
select * from m_savepoints
2. Enable the indexserver trace to get information about the operation and estimate the job progress:
set trace "pageaccess = info"
Snapshots: Reasons Why Reclaim May Fail
In some situations where snapshots are being created RECLAIM may fail:
1. In a high availability scenario RECLAIM may not work because data snapshots which are part of the
replication process may conict with the RECLAIM datavolume command. SAP Note 2332284 - Data
volume reclaim failed because of snapshot pages gives details of how to temporarily stop the creation of
snapshots to avoid this problem.
2. Snapshots related to backups may also prevent RECLAIM from working. SAP Note 2592369 - HANA
DataVolume Full describes steps to investigate the age of snapshots by querying the M_SNAPSHOTS view
SAP HANA Troubleshooting and Performance Analysis Guide
Root Causes and Solutions
PUBLIC 111

and, if necessary, to manually delete snapshots using the hdbcons command. It may then be possible to
rerun the RECLAIM process.
Related Information
Persistent Data Storage in the SAP HANA Database
3.3.2Analyze and Resolve Internal Disk-Full Event (Alert 30)
When it is no longer possible to write to one of the disk volumes used for data, log, backup or trace les,
the database is suspended, an internal event is triggered, and alert 30 is generated. A disk-full event must be
resolved before the database can resume.
Context
If the disks on which the database data and log volumes are located run full, space on the volumes must be
freed or additional space added before the database can resume. In the SAP HANA cockpit, potential disk-full
events are displayed in the alerts app.
However, running out of disk space is not the only reason that SAP HANA may be prevented from writing to
disk. Other possible causes, all of which lead to a disk-full event and alert 30, include:
• File system quota is exceeded
• File system runs out of inodes
• File system errors (bugs)
Note
A number of SAP Notes are available to give troubleshooting advice in specic scenarios. For a log volume
full scenario refer rst to the note 1679938 - DiskFullEvent on Log Volume to resolve the issue and bring the
HANA database back online. Then refer to note 2083715 - Analyzing log volume full situations for root cause
analysis to prevent the scenario from happening again.
For log volume full in a replication context refer to LogReplay: Managing the Size of the Log File in this
document.
• SAP Note 1679938
- DiskFullEvent on Log Volume.
• SAP Note 2083715 - Analyzing log volume full situations.
• SAP Note 1898460
- How to Handle Alert 30 ‘Internal disk-full event’.
• SAP Note 1870858 - HANA Alerts related to le system utilization.
112
PUBLIC
SAP HANA Troubleshooting and Performance Analysis Guide
Root Causes and Solutions
Procedure
1. Analyze disk space usage using the standard administration tools in SAP HANA cockpit: Alerts, Disk Usage,
Disk Volume Monitor.
2. Optional: Perform the following steps if helpful:
Note
You must execute the commands from the command line on the SAP HANA server.
a. Determine the le system type:
df -T
b. Check for disk space using le system specic commands:
Option
Description
XFS/NFS df
GPFS mmfscheckquota
c. Check if the system is running out of inodes (NFS):
df -i
d. Check quota:
Option
Description
XFS/NFS quota -v
GPFS mmfscheckquota
Next Steps
The most serious system events (including the disk-full event) are logged as internal database events in the
table M_EVENTS (see also Alert 21 which is also triggered when an internal event occurs). They are initially
logged with a status of ‘NEW’ and, once the issue has been resolved (in this case, free up disk space), the event
must be set to ‘HANDLED’ to be able to continue. You can do this by executing the following SQL statements:
• ALTER SYSTEM SET EVENT ACKNOWLEDGED '<host>:<port>' <id>
• ALTER SYSTEM SET EVENT HANDLED '<host>:<port>' <id>
If you cannot track down the root cause of the alert, contact SAP Support.
Related Information
LogReplay: Managing the Size of the Log File [page 220]
SAP HANA Troubleshooting and Performance Analysis Guide
Root Causes and Solutions
PUBLIC 113

3.4 I/O Related Root Causes and Solutions
This section covers troubleshooting of I/O performance problems. Although SAP HANA is an in-memory
database, I/O still plays a critical role for the performance of the system.
From an end user perspective, an application or the system as a whole runs slowly, is unresponsive or can even
seem to hang if there are issues with I/O performance. In the Disk Volume Monitor available in the Disk Usage
tile in SAP HANA cockpit you can see the attached volumes and which services use which volumes. For details
of the attached volumes, such as les and I/O statistics, select a row.
In certain scenarios data is read from or written to disk, for example during the transaction commit. Most
of the time this is done asynchronously but at certain points in time synchronous I/O is done. Even during
asynchronous I/O it may be that important data structures are locked.
Examples are included in the following table.
Scenario
Description
Savepoint A savepoint ensures that all changed persistent data since the last savepoint gets written
to disk. The SAP HANA database triggers savepoints in 5 minutes intervals by default. Data
is automatically saved from memory to the data volume located on disk. Depending on the
type of data the block sizes vary between 4 KB and 16 MB. Savepoints run asynchronously
to SAP HANA update operations. Database update transactions only wait at the critical
phase of the savepoint, which is usually taking some microseconds.
Snapshot
The SAP HANA database snapshots are used by certain operations like backup and system
copy. They are created by triggering a system wide consistent savepoint. The system keeps
the blocks belonging to the snapshot at least until the drop of the snapshot. Detailed
information about snapshots can be found in the SAP HANA Administration Guide.
Delta Merge
The delta merge itself takes place in memory. Updates on column store tables are stored
in the delta storage. During the delta merge these changes are applied to the main storage,
where they are stored read optimized and compressed. Right after the delta merge, the new
main storage is persisted in the data volume, that is, written to disk. The delta merge does
not block parallel read and update transactions.
Write Transactions
All changes to persistent data are captured in the redo log. SAP HANA asynchronously
writes the redo log with I/O orders of 4 KB to 1 MB size into log segments. Transactions
writing a commit into the redo log wait until the buer containing the commit has been
written to the log volume.
Database restart
At database startup the services load their persistence including catalog and row store
tables into memory, that is, the persistence is read from the storage. Additionally the redo
log entries written after the last savepoint have to be read from the log volume and replayed
in the data area in memory. When this is nished the database is accessible. The bigger the
row store is, the longer it takes until the system is available for operations again.
Failover (Host Auto-Fail-
over)
On the standby host the services are running in idle mode. Upon failover, the data and log
volumes of the failed host are automatically assigned to the standby host, which then has
read and write access to the les of the failed active host. Row as well as column store tables
(the latter on demand) must be loaded into memory. The log entries have to be replayed.
114 PUBLIC
SAP HANA Troubleshooting and Performance Analysis Guide
Root Causes and Solutions

Scenario Description
Takeover (System Replica-
tion)
The secondary system is already running, that is the services are active but cannot accept
SQL and thus are not usable by the application. Just like in the database restart (see above)
the row store tables need to be loaded into memory from persistent storage. If table preload
is used, then most of the column store tables are already in memory. During takeover
the replicated redo logs that were shipped since the last data transport from primary to
secondary have to be replayed.
Data Backup
For a data backup the current payload of the data volumes is read and copied to the backup
storage. For writing a data backup it is essential that on the I/O connection there are no
collisions with other transactional operations running against the database.
Log Backup Log backups store the content of a closed log segment. They are automatically and asyn-
chronously created by reading the payload from the log segments and writing them to the
backup area.
Database Recovery The restore of a data backup reads the backup content from the backup device and writes
it to the SAP HANA data volumes. The I/O write orders of the data recovery have a size of
64 MB. Also the redo log can be replayed during a database recovery, that is the log backups
are read from the backup device and the log entries get replayed.
In the following table the I/O operations are listed which are executed by the above-mentioned scenarios,
including the block sizes that are read or written:
I/O pattern
Data Volume Log Volume (redo log) Backup Medium
Savepoint,
Snapshot,
Delta merge
WRITE
4 KB – 16 MB asynchronous
bulk writes, up to 64 MB (clus-
tered Row Store super blocks)
Write transactions
WRITE
OLTP – mostly 4 KB log write
I/O performance is relevant
OLAP – writes with larger I/O
order sizes
Table load:
DB Restart,
Failover,
Takeover
READ
4 KB – 16 MB blocks, up to 64
MB (clustered Row Store super
blocks)
READ
Data Backup
READ
4 KB – 16 MB blocks, up to
64 MB (clustered Row Store su-
per blocks) are asynchronously
copied to “[data] backup buf-
fer” of 512 MB
WRITE
in up to 64 MB blocks from
“[data] backup buer”
SAP HANA Troubleshooting and Performance Analysis Guide
Root Causes and Solutions
PUBLIC 115

I/O pattern Data Volume Log Volume (redo log) Backup Medium
Log Backup
READ
asynchronously copied to
“[data] backup buer” of 128
MB
WRITE
in up to 64 MB blocks from
“[data] backup buer”
Database Recovery
WRITE
4 KB – 16 MB blocks, up to 64
MB (clustered Row Store super
blocks)
READ
Read block sizes from backup
le headers and copy blocks
into “[data] backup buer” of
size 512 MB
READ
Read block sizes from backup
le headers and copy blocks
into “[data] backup buer” of
size 128 MB
3.4.1Analyzing I/O Throughput and Latency
When analyzing I/O, the focus is on throughput and latency (time taken). A set of system views (with names
beginning M_VOLUME_IO_*) is available to help you analyze throughput and examples are given here to
illustrate how they can be used.
You can use the following example query to read I/O statistics data which will help you to analyze the
throughput of the system (in this example the index server). The result of this query presents a set of columns
including throughput in MB and trigger ratios (the relationship between trigger time and I/O time) for both read
and write operations:
select v.host, v.port, v.service_name, s.type,
round(s.total_read_size / 1024 / 1024, 3) as "Reads in MB",
round(s.total_read_size / case s.total_read_time when 0 then -1 else
s.total_read_time end, 3) as "Read Throughput in MB",
round(s.total_read_time / 1000 / 1000, 3) as "Read Time in Sec",
trigger_read_ratio as "Read Ratio",
round(s.total_write_size / 1024 / 1024, 3) as "Writes in MB",
round(s.total_write_size / case s.total_write_time when 0 then -1 else
s.total_write_time end, 3) as "Write Throughput in MB",
round(s.total_write_time / 1000 / 1000, 3) as "Write Time in Sec" ,
trigger_write_ratio as "Write Ratio"
from "PUBLIC"."M_VOLUME_IO_TOTAL_STATISTICS_RESET" s, PUBLIC.M_VOLUMES v
where s.volume_id = v.volume_id
and type not in ( 'TRACE' )
and v.volume_id in (select volume_id from m_volumes where service_name =
'indexserver')
order by type, service_name, s.volume_id;
Note that some of the system views for I/O can be used with a resettable counter so that you can
gather data for just the most recent period since the counter was set. This example is based on the
M_VOLUME_IO_TOTAL_STATISTICS system view but uses the ‘reset’ version of the view.
You can reset the statistics counter to analyze the I/O throughput for a certain time frame by running the
following reset command:
alter system reset monitoring view M_VOLUME_IO_TOTAL_STATISTICS_RESET;
116
PUBLIC
SAP HANA Troubleshooting and Performance Analysis Guide
Root Causes and Solutions

Multitier and Replication Scenarios
In a system using replication between primary and secondary sites it is possible to analyze throughput of the
secondary remotely by running these queries on the primary site. This method uses the proxy schema of the
secondary system on the primary and can be used in a 2-tier system replication setup as well as for multitier
landscapes.
The proxy schema follows the naming convention _SYS_SR_SITE_<siteName>, where <siteName> is the
name of the secondary site (case-sensitive). In the FROM clause of the example query given above the
schema PUBLIC is used; in a system replication landscape replace this with the proxy schema, for example:
_SYS_SR_SITE_SiteB':
from "_SYS_SR_SITE_SiteB"."M_VOLUME_IO_TOTAL_STATISTICS_RESET" s,
"_SYS_SR_SITE_SiteB"."M_VOLUMES" v
Note that this specic example will only work in an Active/Active (Read Only) scenario because the view
M_VOLUMES is only available in the proxy view in operation mode logreplay_readaccess, not in other operation
modes.
Trigger Ratios
I/O calls are executed asynchronously, that is, the thread does not wait for the order to return. The trigger-ratio
of asynchronous reads and writes measures the trigger time divided by the I/O time. A ratio close to 0 shows
good performance; it indicates that the thread does not wait at all. A ratio close to 1 means that the thread
waits until the I/O request is completed.
Refer to SAP Note 1930979 and SAP Notes for Alerts 60 and 61 for more information about the signicance of
the trigger ratio values.
Latency
The latency values are important for LOG devices. To analyze the latency, use the following example query
which returns the log write wait time (for data of type LOG) with various buer sizes written by the index server.
The time values returned are the number of microseconds between enqueueing and nishing a request.
select host, port type,
round(max_io_buffer_size / 1024, 3) "Maximum buffer size in KB",
trigger_async_write_count,
avg_trigger_async_write_time as "Avg Trigger Async Write Time in
Microsecond",
max_trigger_async_write_time as "Max Trigger Async Write Time in
Microsecond",
write_count, avg_write_time as "Avg Write Time in Microsecond",
max_write_time as "Max Write Time in Microsecond"
from "PUBLIC"."M_VOLUME_IO_DETAILED_STATISTICS_RESET"
where type = 'LOG'
and volume_id in (select volume_id from m_volumes where service_name =
'indexserver')
and (write_count <> 0 or avg_trigger_async_write_time <> 0);
Related Information
SAP Note 1930979
M_VOLUME_IO_TOTAL_STATISTICS_RESET System View
Alerts Reference [page 301]
SAP HANA Troubleshooting and Performance Analysis Guide
Root Causes and Solutions
PUBLIC 117
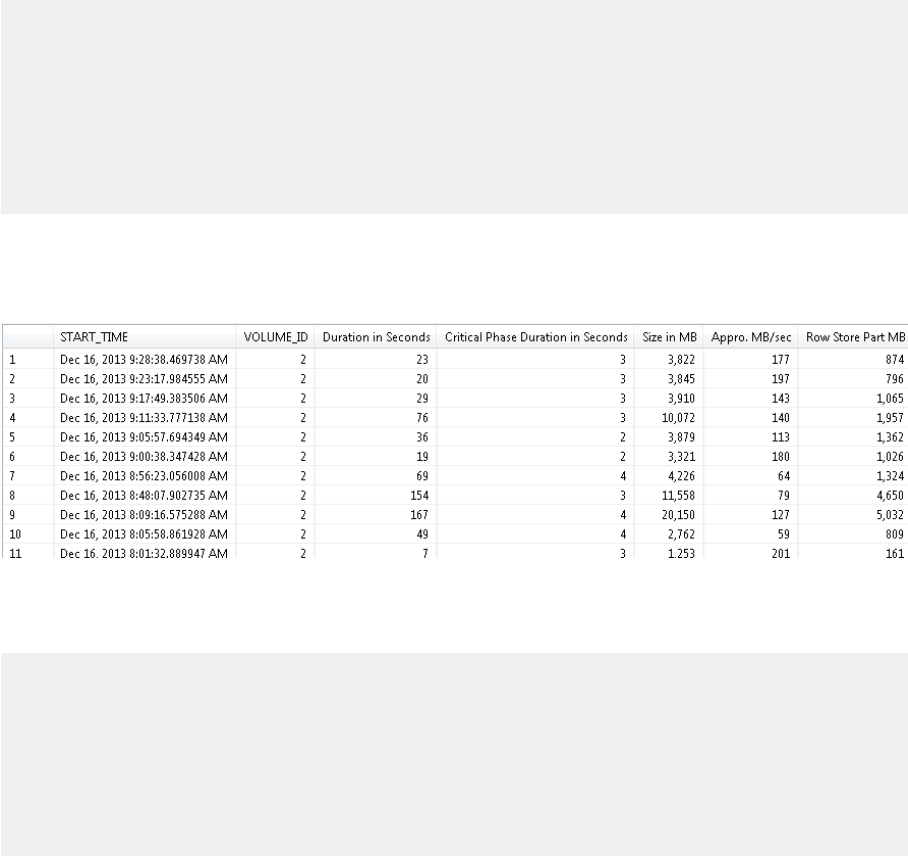
3.4.2Savepoint Performance
To perform a savepoint write operation SAP HANA needs to take a global database lock. Two phases of this
operation, the 'critical phase' and the 'wait for lock' phase can be monitored and optimized if necessary.
Global Database Lock: Critical Phase
Savepoints are used to implement backup and disaster recovery in SAP HANA. If the state of SAP HANA has to
be recovered, the database log from the last savepoint will be replayed.
While SAP HANA is designed to keep the time period of the lock as short as possible, poor I/O performance
can extend it to a length that causes a considerable performance impact. You can analyze the savepoint
performance with this SQL statement which shows how long the last and the current savepoint writes took/are
taking:
select start_time, volume_id,
round(duration / 1000000) as "Duration in Seconds",
round(critical_phase_duration / 1000000) as "Critical Phase Duration in
Seconds",
round(total_size / 1024 / 1024) as "Size in MB",
round(total_size / duration) as "Appro. MB/sec",
round (flushed_rowstore_size / 1024 / 1024) as "Row Store Part MB"
from m_savepoints
where volume_id in ( select volume_id from m_volumes where service_name =
'indexserver') ;
An example of the output is shown here. The critical phase duration, in which savepoints need to take a global
database lock, must be observed carefully. The duration should not be longer than a second. In this example
the times are signicantly higher due to I/O problems.
Savepoints
The following SQL generates a histogram on the critical phase duration, the output is shown below:
select
to_char(SERVER_TIMESTAMP,'yyyy.mm.dd') as "time",
sum(case when (critical_phase_duration <= 1000000) then 1 else 0 end) as "<= 1
s",
sum(case when (critical_phase_duration > 1000000 and critical_phase_duration
<=2000000) then 1 else 0 end) as "<= 2 s",
sum(case when (critical_phase_duration > 2000000 and critical_phase_duration
<=3000000) then 1 else 0 end) as "<= 3 s",
sum(case when (critical_phase_duration > 3000000 and critical_phase_duration
<=4000000) then 1 else 0 end) as "<= 4 s",
118
PUBLIC
SAP HANA Troubleshooting and Performance Analysis Guide
Root Causes and Solutions
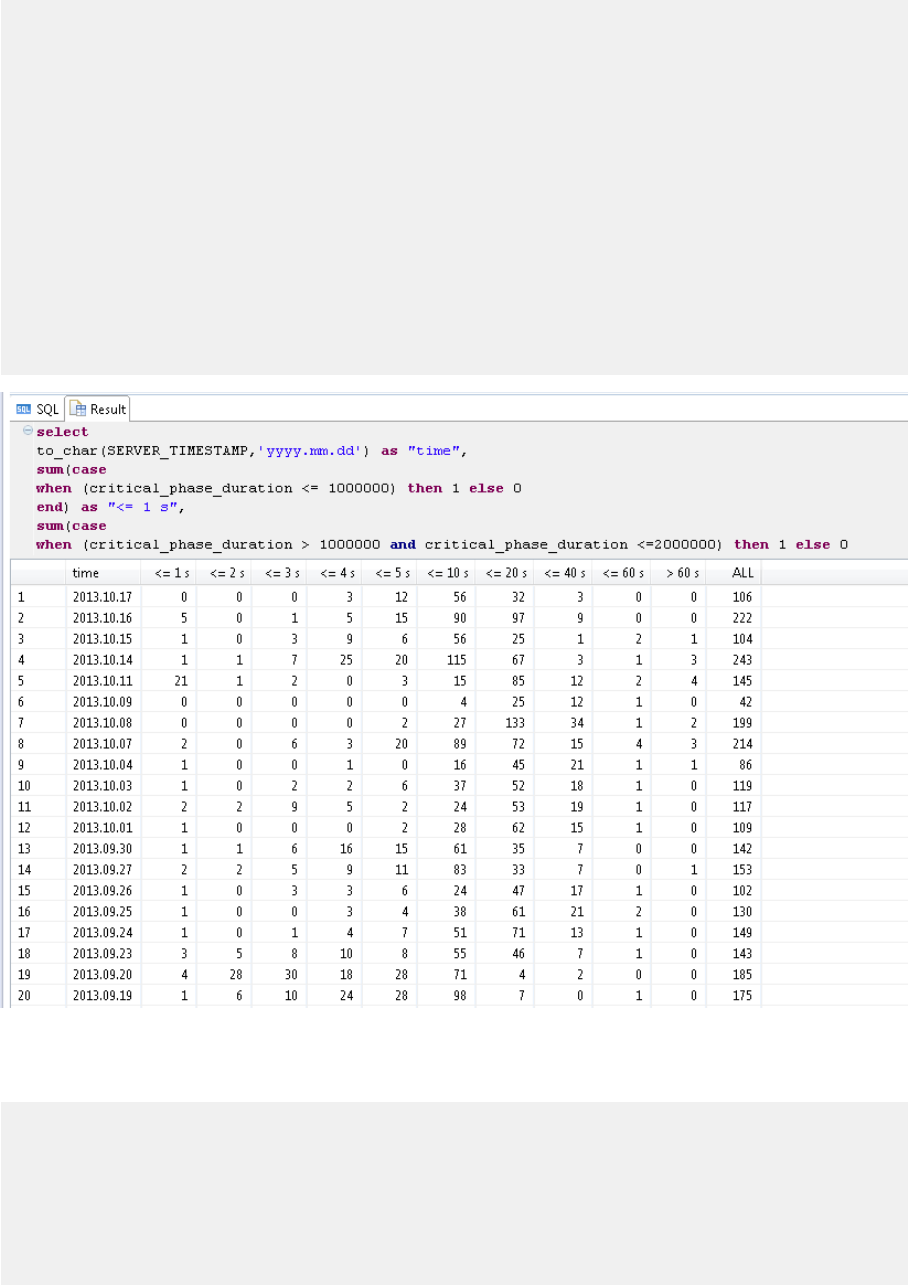
sum(case when (critical_phase_duration > 4000000 and critical_phase_duration
<=5000000) then 1 else 0 end) as "<= 5 s",
sum(case when (critical_phase_duration > 5000000 and critical_phase_duration
<=10000000) then 1 else 0 end) as "<= 10 s",
sum(case when (critical_phase_duration > 10000000 and critical_phase_duration
<=20000000) then 1 else 0 end) as "<= 20 s",
sum(case when (critical_phase_duration > 20000000 and critical_phase_duration
<=40000000) then 1 else 0 end) as "<= 40 s",
sum(case when (critical_phase_duration > 40000000 and critical_phase_duration
<=60000000) then 1 else 0 end) as "<= 60 s",
sum(case when (critical_phase_duration > 60000000 ) then 1 else 0 end) as "> 60
s",
count(critical_phase_duration) as "ALL"
from "_SYS_STATISTICS"."HOST_SAVEPOINTS"
where volume_id in (select volume_id from m_volumes where service_name =
'indexserver')
and weekday (server_timestamp) not in (5, 6)
group by to_char(SERVER_TIMESTAMP,'yyyy.mm.dd')
order by to_char(SERVER_TIMESTAMP,'yyyy.mm.dd') desc;
Savepoint Histogram
The performance of the backup can be analyzed with this statement:
select mbc.backup_id,
SECONDS_BETWEEN (mbc.sys_start_time, mbc.sys_end_time) seconds,
round(sum(backup_size) / 1024 / 1024 / 1024,2) size_gb,
round(sum(backup_size) / SECONDS_BETWEEN (mbc.sys_start_time, mbc.sys_end_time) /
1024 / 1024, 2) speed_mbs
from m_backup_catalog_files mbcf , m_backup_catalog mbc
where mbc.entry_type_name = 'complete data backup'
and mbc.state_name = 'successful'
and mbcf.backup_id = mbc.backup_id
SAP HANA Troubleshooting and Performance Analysis Guide
Root Causes and Solutions
PUBLIC 119
group by mbc.backup_id, mbc.sys_end_time, mbc.sys_start_time order by
mbc.sys_start_time
Wait for Lock Phase
Apart from a long-running 'critical phase', the savepoint can also have long-running 'wait for lock' phases which
can impact the performance of the system. In the waitForLock phase the savepoint must wait for exclusive
access to the ConsistentChangeLock, if another database operation holds this lock for a longer time, delays
are possible.
You can nd further information on the waitForLock phase in the KBA 2100009 FAQ: SAP HANA
Savepoints - refer to question #6 'How can typical savepoint issues be analyzed and resolved?'.
To check if there is a potential issue with the runtime of the waitForLock phase you can use the script
HANA_Conguration_MiniChecks_* (* depending on your HANA database release and revision there are
dierent versions of the script) from the SAP Note 1969700
SQL Statement Collection for SAP HANA.
Where the script nds a potentially critical issue column C in the output is marked with a ‘X’.
CHID DESCRIPTION VALUE EXPECTED VALUE C SAP NOTE
**** SAP HANA MINI
CHECKS
1999993
M0346 Long waitForLock
savepoint phases
(mid-term)
16 0
X
2100009
In many cases long waitForLock phases are caused by HANA internal lock contention. We can use the script
HANA_Conguration_MiniChecks_* to troubleshoot the issue further. In this example from the script in the
‘LOCKS’ section we get an indication that there is an IO issue on the system and an issue with FileIDMapping
contention:
CHID
DESCRIPTION VALUE EXPECTED VALUE C SAP NOTE
M1052 Signicant internal
Lock waits (short-
term)
PageIO::SyncCallb
ackSemaphore
(1.59 threads)
none X
1999998
M1055 Locks with
repeated wait
spikes (long-term)
FileIDMap (48 x
27)
none X
1999998
PageIO::SyncCallb
ackSemaphore
(428 x 28)
none X
1999998
120 PUBLIC
SAP HANA Troubleshooting and Performance Analysis Guide
Root Causes and Solutions

IO Bottlenecks
More information about locks is available in KBA 1999998 - FAQ: SAP HANA Lock Analysis; there, the
meaning of lock PageIO::SyncCallbackSemaphore, is described as follows:
Starting with SAP HANA 2.0 synchronous I/O requests are implicitly executed as asynchronous I/O requests.
The PageIO::SyncCallbackSemaphore indicates that the thread is currently waiting for the asynchronous I/O
request to nish properly. See SAP Note 1999930 for tuning SAP HANA I/O performance.
This indicates that there is an IO bottleneck on the system and the IO throughput is too slow at times.
You can conrm this by executing the script HANA_IO_Savepoints_* (*depending on your HANA Database
release and revision there are dierent versions of the script) from the SQL Statement Collection for SAP
HANA. In this case you can make a change in the modication section to only collect information where
MIN_WAIT_FOR_LOCK_PHASE_DURATION_S runs for 10 seconds or greater:
( SELECT /* Modification section */
'1000/10/18 07:58:00' BEGIN_TIME,
'9999/10/18 08:05:00' END_TIME,
'SERVER' TIMEZONE,
'%' HOST,
'%' PORT,
-1 VERSION,
-1 MIN_BLOCKING_PHASE_DURATION_S,
10 MIN_WAIT_FOR_LOCK_PHASE_DURATION_S,
-1 MIN_CRITICAL_PHASE_DURATION_S,
The script has the following output parameters; the columns 'LOCK_S' and 'MB_PER_S' are particularly
signicant here:
[OUTPUT PARAMETERS]
- START_TIME: Start time of considered time interval
- BLK_PHASE_START_TIME: Start time of blocking phase
- CRIT_PHASE_START_TIME: Start time of critical phase
- END_TIME: End time of savepoint
- START_TIME: Start time of considered time interval
- HOST: Host
- PORT: Port
- VERSION: Savepoint version
- COUNT: Number of savepoints
- P: Savepoint purpose ...
- I: Savepoint initiation (E -> EXECUTED_EXPLICITLY, T ->
TRIGGERED_TIMEBASED)
- AGG: Aggregation type used for the subsequent output columns
(MAX -> maximum, AVG -> average, SUM -> total)
- RETRIES: Number of flush retries in the non-critical phase
- TOTAL_S: Savepoint duration (s)
- BLK_S: Blocking phase (s), i.e. time when DML operations can
be blocked
- LOCK_S: waitForLock phase duration (s)
- CRIT_S: Critical phase duration (s)
- SIZE_MB: Savepoint write size (MB)
- MB_PER_S: Write throughput (MB / s)
- RS_SIZE_PCT: Flushed data related to rowstore compared to overall
flushed data (%)
SAP HANA Troubleshooting and Performance Analysis Guide
Root Causes and Solutions
PUBLIC 121
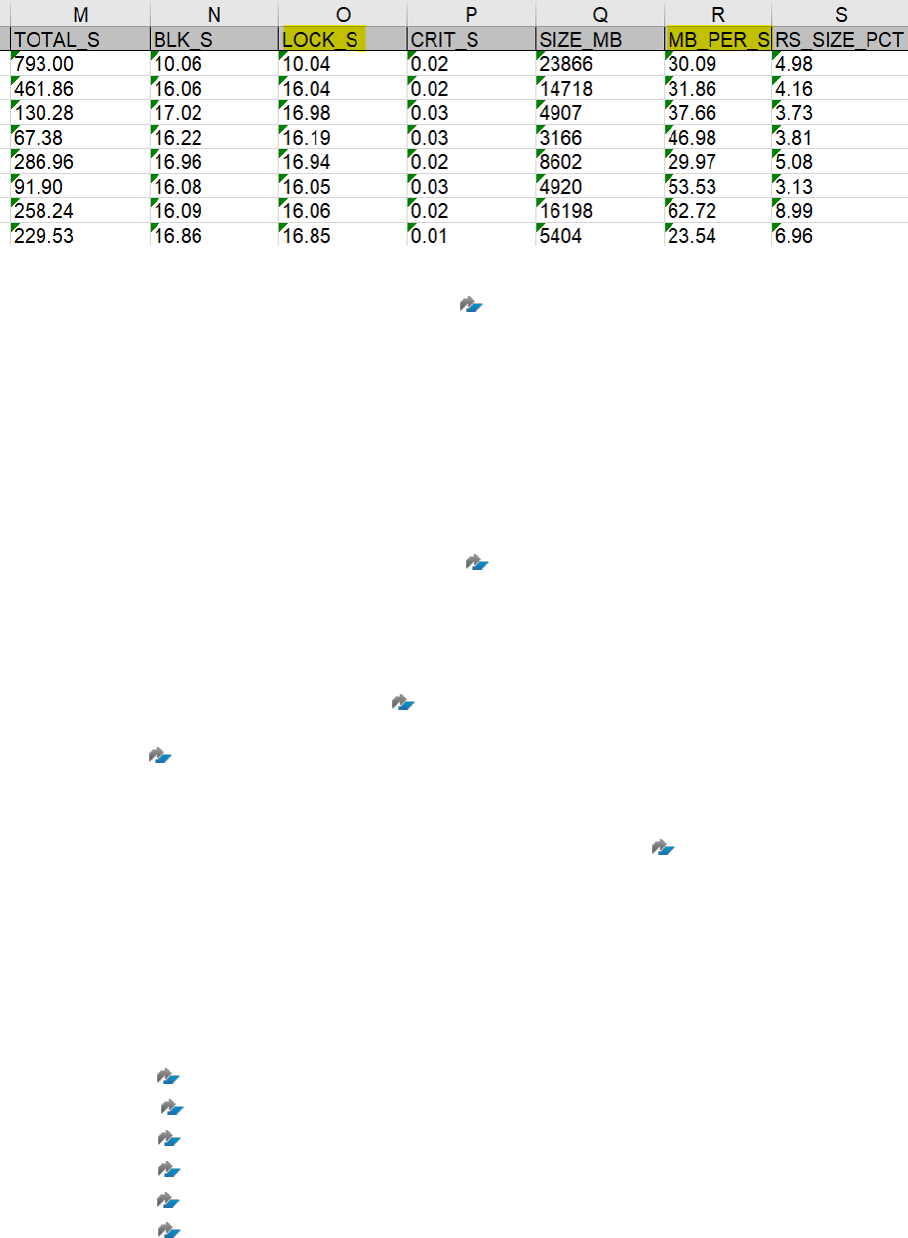
In the example output shown here we can see that the throughput (MB_PER_S) is very low at the times of the
long running waitForLock phases (LOCK_S):
In this case your Storage/IO Team need to do a deeper analysis of the IO layers and optimize the IO to meet
the workload requirements of the system. KBA 1999930
- FAQ: SAP HANA I/O Analysis can be used as a
starting point for the IO analysis and optimization.
Lock Contention
Regarding the issue related to ‘FileIDMapping’ contention, the ConsistentChangeLock can be held by
threads waiting for FileIDMapping locks, so ConsistentChangeLock waitscan be a secondary symptom of
FileIDMapping contention.In that case you must analyzeand resolve the FileIDMapping contention, then the
ConsistentChangeLock contention will improve.
For more information and potential root causes of this issue see question #15 'What are common reasons for
ConsistentChangeLock contention?' in the KBA 1999998 - FAQ: SAP HANA Lock Analysis.
Run-time Dump
If the above does not allow you to resolve the issue, as per the information on the waitForLock phase in the
section ‘Long waitForLock phase’ under Header ‘Symptom’ from question 6. 'How can typical savepoint issues
be analyzed and resolved?' of the KBA 2100009 - FAQ: SAP HANA Savepoints, you can generate a runtime
dump to collect more detailed information on the root cause of the long runtime of the waitForLock phase.
The KBA 3014528 - How-To: Analyzing blocked savepoint runtime dumps gives specic information about
analyzing runtime dumps in relation to locks and savepoints.
Automated analysis of blocked save point runtime dumps is possible using the SAP HANA Dump Analyzer
Supportability Tool, see the section ‘Savepoint Analyzer’ from the KBA 2498739 - How-To: Analyzing
Runtime Dumps with SAP HANA Dump Analyzer, for further information.
Related Information
Using the SQL Statement Collection for Analysis and Health Checks [page 8]
SAP Note 1969700
SAP Note 2100009
SAP Note 1999930
SAP Note 1999998
SAP Note 3014528
SAP Note 2498739
122
PUBLIC
SAP HANA Troubleshooting and Performance Analysis Guide
Root Causes and Solutions
3.5 Conguration Parameter Issues
The SAP HANA database creates alerts if it detects an incorrect setting for any of the most critical
conguration parameters.
The following table lists the monitored parameters and related alerts.
Alerts related to conguration
Alert ID
Alert Name Parameter Further Information
10 Delta merge (mergedog)
conguration
Indexserver.ini – mergedog - active Delta Merge
16 Lock wait timeout cong-
uration
Indexserver.ini – transaction –
lock_wait_timeout
Transactional Problems
32 Log mode legacy Global.ini – persistence – log_mode Issues with Conguration Parameter
log_mode (Alert 32 and 33)
33 Log mode overwrite Global.ini – persistence – log_mode Issues with Conguration Parameter
log_mode (Alert 32 and 33)
To check for parameters that are not set according to the default values you can use the following SQL
statement:
select a.file_name, b.layer_name, b.tenant_name, b.host, b.section, b.key,
a.value as defaultvalue, b.currentvalue from sys.m_inifile_contents a
join ( select file_name, layer_name, tenant_name, host, section, key,
value as currentvalue from sys.m_inifile_contents b where layer_name
<> 'DEFAULT' )
b on a.file_name = b.file_name and a.section = b.section and a.key = b.key
and a.value <> b.currentvalue
Alternatively, use the script 'HANA_Conguration_Parameters_2.00.040+' in the SQL Statement Collection
for SAP HANA (see SAP Note 1969700). The output of this script will list all parameters deviating from
recommended settings.
Note
Default values of parameters may change when updating the SAP HANA database with a new revision.
Custom values on the system level and on the host level will not be aected by such updates.
Correcting Parameter Settings
You can change conguration parameters using the SAP HANA cockpit or the ALTER SYSTEM ALTER
CONFIGURATION statement.
All conguration parameters are dened in table CONFIGURATION_PARAMETER_PROPERTIES. You can look
up parameter details either in the system using for example SAP HANA cockpit or by referring to the
Conguration Parameter Reference Guide in the SAP Help Portal. In addition to basic properties such as data
type, unit and a default value the denition includes a ag to indicate if a system restart is required before a
changed value becomes eective.
SAP HANA Troubleshooting and Performance Analysis Guide
Root Causes and Solutions
PUBLIC 123

The SAP Note 2600030 - Parameter Recommendations in SAP HANA Environments is updated regularly with
version-specic information covering cases where conguration parameter settings other than the default
values are recommended.
Usually alerts on incorrect parameter settings include information about correct setting of the parameter. So,
unless you have received a specic recommendation from SAP to change the parameter to another value,
you can x the issue by changing the parameter from the Conguration of System Properties monitor of SAP
HANA cockpit. You can search for a specic parameter by ltering on the parameter name. In most cases the
suggested correct value will be the default value. Most of the parameters can be changed online and do not
require any further action; exceptions for common parameters are noted in the reference document referred to
above. For more information about how to change parameters, see Memory Information from Logs and Traces.
Note
Make sure that you change the parameter in the correct ini-le and section, since the parameter name
itself may be not unique.
Related Information
Delta Merge [page 129]
Transactional Problems [page 167]
Issues with Conguration Parameter log_mode (Alert 33) [page 124]
Memory Information from Logs and Traces [page 66]
SAP Note 2600030
SAP Note 1969700
SAP HANA Conguration Parameter Reference
3.5.1Issues with Conguration Parameter log_mode (Alert
33)
Alert 33 is raised whenever the write mode to the database log is not set correctly for use in production.
Context
To ensure point-in-time recovery of the database the log_mode parameter must be set to ‘normal’ and a data
backup is required.
124
PUBLIC
SAP HANA Troubleshooting and Performance Analysis Guide
Root Causes and Solutions

The following steps are recommended when facing this alert:
Procedure
1. Change the value of the parameter log_mode to normal. You can do this in SAP HANA cockpit or from the
command line.
2. Schedule an initial data backup
3. Test successful completion of the backup
4. Backup the database conguration
For information on how to perform a backup of database conguration les see SAP Note 1651055 -
Scheduling SAP HANA Database Backups in Linux.
5. Schedule a regular data backup
Related Information
Alerts Reference [page 301]
SAP Note 1651055
SAP Note 1900267
3.6 Backup And Recovery
This section discusses issues related to backup and recovery and how to troubleshoot them.
Back and Recovery: Resources
For detailed information on how to perform a backup or recovery of an SAP HANA database please refer to
section SAP HANA Database Backup and Recovery of the SAP HANA Administration Guide.
Note
Following the conguration information, prerequisites and requirements for your HANA release and revision
as documented in the SAP HANA Administration Guide can avoid the most common issues faced by
customers when performing a backup or recovery.
Backup and Recovery can be done in SAP HANA studio or in SAP HANA cockpit; refer to the documentation for
these administration tools for details.
SAP HANA Troubleshooting and Performance Analysis Guide
Root Causes and Solutions
PUBLIC 125
The following links to the SAP HANA Support Content provide a step-by-step description with detailed
screenshots of how Backup and Recovery can be executed from SAP HANA studio:
• How to Perform a Backup
• Recovery
In addition to the SAP Notes and Knowledge Base Articles referred to in this section, the following may also be
useful:
• SAP Note 1642148 - FAQ: SAP HANA Database Backup & Recovery
• SAP Note 2116157 - FAQ: SAP HANA Consistency Checks and Corruptions
• SAP KBA 2101244 - FAQ: SAP HANA Multitenant Database Containers (MDC)
• SAP Note 2096000 - SAP HANA multitenant database containers - Additional Information
• SAP KBA 2486224
- Tenant DB recovery to another system Tenant DB
• SAP Note 2093572 - SAP HANA Migration from Multi-Node to Single-Node
• SAP Note 1730932 - Using backup tools with Backint for HANA
• SAP Note 1651055 - Scheduling SAP HANA Database Backups in Linux
• SAP Note 2044438 - HANA: Backup fails for Out Of Memory error
• SAP Note 2123153
- HANA Recovery Failing with 'recovery strategy could not be determined'
• SAP Note 2063454
- Long running log backups
• SAP KBA 2495074 - Recovery failed with data backup le of higher HANA revision
• SAP KBA 1990971
- HANA backup failed with 'Wrong Checksum' error
• SAP Note 2605215 - Replay of Logs Hanging During Point in Time Recovery or Operations on System
Replication Secondary Site
Logs and Trace Files
In most cases for both backup and recovery issues a relevant error message will be written to the following SAP
HANA database log or trace les:
• backup.log
• namesever.trc
• backint.log (if using backint and 3rd party tool)
These log and trace les (diagnostic les) can be found using SAP HANA studio, DBA Cockpit, and SAP HANA
Database Explorer. The default location for the les is:
/usr/sap/<SID>/HDB<Instance#>/<host>/trace
You can search for either backup or recovery tasks which generate an error in the backup.log le by referring to
the task type and the date and time that the issue occurred:
2018-09-26T06:58:11+00:00 16614abbef0 INFO BACKUP SAVE DATA started
2018-08-29T09:45:52+00:00 1658510b5bb ERROR BACKUP SAVE DATA finished with
error: [447] backup could not be completed ….rc=28: No space left
2018-08-29T09:45:52+00:00 1658510b5bb INFO BACKUP state of service…
With the error code and error message you can search for SAP Notes and Knowledge Base Articles in the SAP
Knowledge Base using SAP ONE Support Launchpad
126
PUBLIC
SAP HANA Troubleshooting and Performance Analysis Guide
Root Causes and Solutions
Increasing the trace level
Although in most cases it should not be necessary to use the debug trace level to nd the relevant error
message, if the standard trace level for the backup.log le does not return a meaningful error message you can
temporarily set the level to 'debug' using the following commands:
Enable the trace:
ALTER SYSTEM ALTER CONFIGURATION ('global.ini', 'SYSTEM') SET ('trace',
'backup') = 'debug' with reconfigure;
Disable the trace:
ALTER SYSTEM ALTER CONFIGURATION ('global.ini', 'SYSTEM') UNSET ('trace',
'backup') with reconfigure;
Common Issues Related to Backup and Recovery
Some of the most common issues are described here.
Log Volume Full
The symptoms of a log volume full are:
• Alert #2 is generated, for example: "Alert disk usage" for "storage type: LOG".
• The database cannot be started or does not accept new requests.
• The database trace le of a service contains rc=24 no space left on device errors for the
basepath_logvolumes or basepath_logbackup.
Note
Note that when a cluster le system like HP IBRIX or IBM GPFS is used, HANA Studio or OS commands
like df -h might not detect a problem. In this case use the lesystem specic commands like mmdf/
mmrepquota for IBM GPFS.
In this situation reasons for data and log backups failing may include:
• Backup location for data and log backup is the same location as data and log volumes and space runs out
• Automatic log backup parameter is not enabled (enable_auto_log_backup). If automatic log backup is
disabled, the log area grows until the le system is full. If the le system is full, the database will remain
frozen until the situation is resolved.
See the following SAP Notes for troubleshooting details in this case:
• 2083715 - Analyzing log volume full situations.
• 1679938 - Disk Full Event on Log Volume.
Large Size of Log Backup Files
The backup catalog stores information about the data and log backups that were executed for a database
and the catalog is backed up as part of the log backups. If you do not ensure that old backups are deleted in
accordance with backup and recovery strategy the log backups can become increasingly large over time.
SAP HANA Troubleshooting and Performance Analysis Guide
Root Causes and Solutions
PUBLIC 127

For information on the clean-up of the backup catalog see the following:
• Housekeeping for backup.log and backint.log in the SAP HANA Administration Guide
• KBA 2096851 - Backup Catalog Housekeeping within HANA DB
• KBA 2505218 - Large Log Backups due to large backup catalog
Regular manual consistency check of backups required for SAP HANA Database Recovery
Although HANA has automatic checks that take place while data and log backups are performed you should
manually re-check the integrity of any backup if it is copied or moved to another location or if you need to use
the backup les for HANA database recovery. This manual check can be done using hdbbackupcheck.
For information on the usage of the hdbbackupcheck command see the KBA 1869119 - Checking backups
with 'hdbbackupcheck'
Problems With Backint and 3rd Party Backup Tools
SAP HANA comes with native functionality for backup and recovery but using 3rd party backup tools is an
alternative to using the native functionality. SAP HANA database provides a backup interface called Backint
which enables 3rd-party backup tool vendors to connect their product to the backup and recovery capabilities
of the SAP HANA database. Backint is fully integrated into the SAP HANA database, that is, data and log
backups can be individually congured to be created and recovered using the 3rd-party backup tool. Backups
are transferred via named pipe from the SAP HANA database to the 3rd party backup agent, which runs on the
SAP HANA database server and then sends the backups to the 3rd party backup server.
For more information on SAP HANA backup and recovery and the integration of 3rd party backup tools with
SAP HANA, please refer to:
• The SAP HANA Administration Guide
• The installation documentation for 3rd party backup tools provided by the tool vendor
• SAP Note 2031547 - Overview of SAP-certied 3rd party backup tools and associated support process
If you face an issue with a 3rd party backup tool check SAP Note 2031547 to conrm that the backup tool
is supported. If the tool is supported the next step is to check for error messages in the backint.log le as
described above. Follow the appropriate support process for the tool as described in this SAP note.
As a workaround for a problem with a 3rd party backup tool, and if you have the required disk space, you could
use the SAP HANA native functionality for backup.
Backint Pipe Size
A cause of slow performance related to backint and SUSE Linux Enterprise Server 15 SP4 may be related
to the default pipe size. Due to a change in the default conguration of the maximum size of a pipe in
the operating system, the data transfer rate of backint may be restricted. In HANA 2.0 SPS 07 (072.00)
a conguration parameter was introduced which makes it possible to set the pipe capacity. The parameter
backint_pipe_capacity (in the backup section of the global.ini le) is not active by default but can be set
to a number of bytes to override the default capacity of the operating system. Further details and examples of
how this can be applied are given in SAP Note 3417100 - HANA Database Backup or Recovery using Backint
for SAP HANA is very slow.
128
PUBLIC
SAP HANA Troubleshooting and Performance Analysis Guide
Root Causes and Solutions

HANA BACKUP and Recovery Performance
In many cases, problems with backup and recovery performance are related to non-optimal system I/O or the
backup catalog size.
To check the HANA I/O performance refer to the Knowledge Base article 1999930 - FAQ: SAP HANA I/O
Analysis. Regarding the backup catalog refer to the subsection above Large size of Log Backup les.
To analyze performance problems related to backup and recovery you can also refer to the guided answer
Troubleshooting Performance Issues in SAP HANA, if the guided answer does not provide a solution for further
analysis SAP Support would require the information in the SAP Note 1835075 - Analyze backup and recovery
performance issues.
Related Information
SAP HANA Database Backup and Recovery (SAP HANA Administration Guide)
3.7 Delta Merge
This section covers troubleshooting of delta merge problems.
The column store uses ecient compression algorithms to keep relevant application data in memory.
Write operations on the compressed data are costly as they require reorganizing the storage structure
and recalculating the compression. Therefore write operations in column store do not directly modify the
compressed data structure in the so called main storage. Instead, all changes are at rst written into a separate
data structure called the delta storage and at a later point in time synchronized with the main storage. This
synchronization operation is called delta merge.
From an end user perspective, performance issues may occur if the amount of data in the delta storage is large,
because read times from delta storage are considerably slower than reads from main storage.
In addition the merge operation on a large data volume may cause bottleneck situations, since the data to be
merged is held twice in memory during the merge operation.
The following alerts indicate an issue with delta merges:
• Delta merge (mergedog) conguration (Alert 10)
• Size of delta storage of column store tables (Alert 29)
Related Information
SAP Note 1909641
SAP Note 1977314
SAP HANA Troubleshooting and Performance Analysis Guide
Root Causes and Solutions
PUBLIC 129

3.7.1Inactive Delta Merge
In case the delta merge is set to inactive, Alert 10 Delta merge (mergedog) conguration is raised. In a
production system this alert needs to be handled with very high priority in order to avoid performance issues.
Context
Whenever issues with delta merge are suspected, this alert should be checked rst. You can do that from the
Alerts tile or the Alert Checker Conguration app. An inactive delta merge has a severe performance impact on
database operations.
Procedure
1. Check the current parameter value in the Conguration of System Properties page of SAP HANA cockpit
and lter for mergedog.
Check the value of active in the mergedog section of the indexserver.ini le.
2. To correct the value, click Change Layer and choose Restore Default.
This will delete all custom values on system and host level and restore the default value system-wide.
Note
Depending on the check frequency (default frequency: 15 minutes) the alert will stay in the Alert inbox
until the new value is recognized the next time the check is run.
Related Information
SAP Note 1909641
Memory Information from Logs and Traces [page 66]
3.7.1.1 Retrospective Analysis of Inactive Delta Merge
Retrospective analysis of the root cause of the parameter change that led to the conguration alert requires the
activation of an audit policy in SAP HANA that tracks conguration changes.
Other sources of information are external tools (for example, SAP Solution Manager) that create a snapshot of
conguration settings at regular intervals.
For details about conguring security auditing and for analyzing audit logs, refer to the SAP HANA Security
Guide.
130
PUBLIC
SAP HANA Troubleshooting and Performance Analysis Guide
Root Causes and Solutions

Related Information
SAP HANA Security Guide
3.7.2Indicator for Large Delta Storage of Column Store
Tables
If the delta storage of a table gets too large, read operations on the table will slow down. This usually results in
degraded performance of queries reading from the aected table.
When the delta storage of a table gets too large, the Alert Size of delta storage of column-store tables (Alert 29)
can be raised.
Alert 29 is raised when the amount of memory consumed by the delta storage exceeds the congured
thresholds. The thresholds can be customized in the SAP HANA cockpit to take into account the congured
size of the delta storage. Note that if the alerts are not congured properly, the symptoms can occur without
raising an alert, or there may be no symptoms, even though an alert is raised. For each aected table a
separate alert is created.
Usually this problem occurs because of mass write operations (insert, update, delete) on a column table. If the
total count of records (record count * column count) in the delta storage exceeds the threshold of this alert
before the next delta merge, this alert will be triggered.
Corrective action needs to be taken in one of the following areas:
• Change of an application
• Changed partitioning of the table
• Conguration of delta merge
Related Information
SAP Note 1977314
SAP HANA Troubleshooting and Performance Analysis Guide
Root Causes and Solutions
PUBLIC 131

3.7.2.1 Analyze Large Delta Storage of Column Store
Tables
Analyze and interpret issues related to delta storage with help from alerts in SAP HANA cockpit.
Procedure
1. If an alert was raised, go to the Alerts tile in the SAP HANA cockpit, click Show all and lter for "delta
storage".
Check if the alert is raised for a small number of tables or for many tables. Focus on tables where the alert
has high priority. Alerts raised with low or medium priority usually don’t need immediate action, but should
be taken as one indicator for checking the sizing. Also these alerts should be taken into account when
specic performance issues with end-user operations on these tables are reported, since read-access on
delta storage may be one reason for slow performance.
2. Click on an alert and check the alert details about its previous occurrences visible in the graph.
a. If the alert occurred several times, check since when this started. To monitor a longer period of time,
use the drop-down menu on the right.
b. Check whether it occurs regularly at a certain time.
This may indicate a specic usage pattern from application side that might have room for optimization.
For example, when many inserts and deletes are performed during a load process, it might be possible
to replace these operations with a suitable lter in the source system. You can employ the data in
the Expensive Statement Trace and the Performance Monitor to determine the usage of the table by
applications.
3. Check the timestamp of the alert if it is current, then start with checking current attributes of this table.
Information regarding the delta merge operation on specic tables can be obtained from the system view
M_CS_TABLES.
SELECT * FROM SYS.M_CS_TABLES where table_name='mytable' and
schema_name='myschema';
If no alert was raised, you can check for the tables with the most records in the delta.
SELECT * FROM SYS.M_CS_TABLES where record_count>0 order by
raw_record_count_in_delta desc;
4. Check the following attributes:
• LAST_MERGE_TIME
• MERGE_COUNT
• READ_COUNT, WRITE_COUNT
• RECORD_COUNT
• RAW_RECORD_COUNT_IN_MAIN
• RAW_RECORD_COUNT_IN_DELTA
• MEMORY_SIZE_IN_MAIN
• MEMORY_SIZE_IN_DELTA
132
PUBLIC
SAP HANA Troubleshooting and Performance Analysis Guide
Root Causes and Solutions
a. If MERGE_COUNT is high then this is an indicator that the delta merge works properly, while a low
MERGE_COUNT suggests a need for corrective action.
A large dierence between RAW_RECORD_COUNT_IN_MAIN and RECORD_COUNT suggests that the
table has not been compressed properly. Note that compression is not triggered when a merge is
triggered from an SQLScript, but only in case of Auto, Smart or Critical Merge.
A high WRITE_COUNT suggests that many insert, update and delete operations occur. If the
occurrence of the delta merge problem is rare, then it usually will be sucient to trigger the merge
for this table manually. See Perform a Manual Delta Merge Operation in the SAP HANA Administration
Guide.
b. If there are many deleted records, you can trigger a compress of the table with the following command:
UPDATE mytable WITH PARAMETERS('OPTIMIZE_COMPRESSION'='YES');
c. Conrm the delta merge operation has succeeded in the following ways:
• LAST_MERGE_TIME
• MERGE_COUNT
• RAW_RECORD_COUNT_IN_DELTA
• LAST_COMPRESSED_RECORD_COUNT
5. If problems with the delta storage re-occur frequently for a specic table, check the merge statistics for
this table. You can do this in the SAP HANA database explorer by executing the Merge Statistics statement
in the Statement Library. You can lter by table name and schema name.
Alternatively you can run the following SQL statement and perform the following checks:
SELECT * FROM SYS.M_DELTA_MERGE_STATISTICS where table_name='mytable' and
schema_name='myschema';
a. Check column SUCCESS for records with value other than TRUE.
b. Check the column LAST_ERROR for records with value other than 0. A typical error is 2048 and
ERROR_DESCRIPTION shows error 2484 which indicates that there was not enough memory to
compress the table after the merge.
For other error codes please refer to the SAP HANA Administration Guide.
c. Check the columns START_TIME, EXECUTION_TIME, MOTIVATION and MERGED_DELTA_RECORDS.
For cases where MERGED_DELTA_RECORDS becomes excessively large the trigger function for
the MOTIVATION type should be reviewed and the LOAD should be analyzed for that time frame
(
Performance Monitor ). A value of MERGED_DELTA_RECORDS = -1 suggests that no records were
merged but that a compression optimization was performed.
6. If you need to analyze the delta merge statistics for a longer period, use the equivalent select on table
HOST_DELTA_MERGE_STATISTICS of the statistics server:
SELECT * FROM _SYS_STATISTICS.HOST_DELTA_MERGE_STATISTICS where
table_name='mytable' and schema_name='myschema';
You can check the delta merge conguration in SAP HANA cockpit by opening
Conguration of System
Properties indexserver.ini mergedog .
Since the default value for the frequency of delta merges is already 1 minute (check_interval = 60.000
ms), optimization with regards to memory consumption can only be done by adjusting the decision
function of the corresponding merge type and the corresponding priority function. However, changes
SAP HANA Troubleshooting and Performance Analysis Guide
Root Causes and Solutions
PUBLIC 133
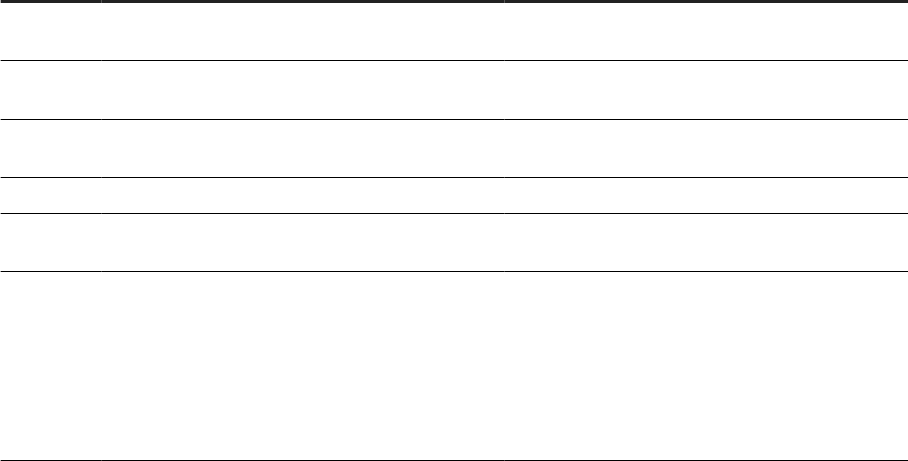
should be done very carefully and always with involvement of experts from SAP. Parameters of the
functions are documented in the SAP HANA Administration Guide.
Related Information
M_CS_TABLES System View (SAP HANA SQL Reference)
Alerts
Inactive Delta Merge [page 130]
Use the Statement Library to Administer Your Database
Memory Information from Logs and Traces [page 66]
3.7.3Failed Delta Merge
If many cases are identied where auto merge has failed, the error codes need to be analyzed in more
detail. Note that the merge only failed if SUCCESS is not TRUE. In any other case the error code describes a
non-critical condition during a successful merge.
To analyze the error codes, you should increase the trace level to INFO for the components mergedog and
mergemonitor in the INDEXSERVER section of the Database Trace.
To change the trace conguration choose Trace Conguration from the database context menu in the SAP
HANA database explorer and change the conguration of the Database Trace.
The following table lists error codes and typical corrective actions.
Error Codes
Error
Description Recommended Action
1999 General error (no further information available) Check the indexserver trace for more errors regarding
the exception
2450 Error during merge of delta index occurred Check in diagnostic les for an Out-Of-Memory dump
that occurred during the delta merge operation
2458 Table delta merge aborted as cancel was manually
requested by a kill session call.
No action required.
2480 The table in question is already being merged. No action required.
2481 There are already other smart merge requests for this
table in the queue.
No action required.
2482 The delta storage is empty or the evaluation of the
smart merge cost function indicated that a merge is
not necessary.
No further action required if this occurs occasionally.
If it happens frequently:
Check M_DELTA_MERGE_STATISTICS and review
smart merge cost function with SAP experts.
(parameter smart_merge_decision_func)
134 PUBLIC
SAP HANA Troubleshooting and Performance Analysis Guide
Root Causes and Solutions

Error Description Recommended Action
2483 Smart merge is not active (parameter
smart_merge_enabled=no)
Change the parameter
smart_merge_enabled=yes)
2484 Memory required to optimize table exceeds heap
limit (for failed compression optimization operations,
TYPE=SPARSE, SUCCESS=FALSE).
No further action required if this occurs occasionally.
If it happens frequently:
A) Analyze change operations on the table and con-
sider table partitioning to minimize the size of the
delta storage. If no knowledge about application is
available, Hash Partitioning with a size of 500.000.00
records is a good initial choice.
B) Analyze change operations on the ta-
ble and consider adjusting the parameter
auto_merge_decision_func
C) Increase delta storage
D) Review sizing
6900
Attribute engine failed Internal error. Check the indexserver trace for more
errors regarding the exception.
29020 ltt::exception caught while operating on $STORA-
GEOBJECT$
Internal error. Check the indexserver trace for more
errors regarding the exception.
Related Information
Memory Information from Logs and Traces [page 66]
3.7.4Delta Storage Optimization
Table partitioning allows you to optimize the size of tables in memory and their memory consumption as each
partition has its own delta storage.
The memory consumption of a table in memory during a merge operation depends on the number of records,
the number and memory size of columns and the memory size of the table. While the number of records can
be kept low by triggering a smart merge from the application, optimization with regards to the size of the
table can be achieved by table partitioning. This is due to the fact that each partition holds a separate delta
storage. When a merge is performed, the data from the main storage has to be loaded into memory which is a
considerably less amount when only a single partition is handled rather than the full table.
When considering partitioning it is recommended to analyze the typical usage of this table. Partitions should be
created in a way that avoids as much as possible that single statements need to access multiple partitions. If
no application knowledge is available, then hash partitioning with a partition size of about 500.000.000 records
is a good initial choice.
See, Table Partitioning in the SAP HANA Database in the SAP HANA Administration Guide.
SAP HANA Troubleshooting and Performance Analysis Guide
Root Causes and Solutions
PUBLIC 135

Related Information
Table Partitioning
3.8 Post-Installation Problems with Web IDE
This section identies some common post-installation issues which you may encounter when working with
WebIDE.
Logging in to Space Enablement UI
Issue: Logging into space enablement UI gives a 'Forbidden' error.
Cause: Missing authorizations.
Resolution:
Ensure that the user logging into the di-space-enablement-ui app has the proper
authorizations as follows:
• The role collection XS_CONTROLLER_USER
• A manually-created role collection containing WebIDE_Administrator and/or
WebIDE_Developer role.
• SpaceDeveloper role and/or SpaceManager role.
More Information: For more information see the following documents (depending on your SAP HANA version):
• For SAP HANA version below HANA 2 SPS3 see 'Post-Installation Administration Tasks' in
SAP Web IDE for SAP HANA - Installation and Upgrade Guide
• For HANA 2 SPS3 and above see 'Roles and Permissions for Administration and
Development' in: SAP HANA Developer Guide for SAP HANA XS Advanced Model .
Logging into Web IDE
Issue:
Logging into WebIDE gives an internal server error or shows a blank page.
Cause: Missing authorizations
Resolution: Ensure the WebIDE User has the correct role collections and is part of space as
SpaceDeveloper (role).
More Information: For more information see 'Roles and Permissions for Administration and Development' in the
SAP HANA Developer Guide for SAP HANA XS Advanced Model.
136 PUBLIC
SAP HANA Troubleshooting and Performance Analysis Guide
Root Causes and Solutions
Unable to access di-local-npm-registry
Issue:
When trying to access the URL for di-local-npm-registry to check if a given node
module is present and check if the versions are available, the following error message appears:
"Error: web interface is disabled in the config file"
Cause:
Access to the web interface of di-local-npm-registry is disabled for security reasons.
Resolution: 1. Run the following command:
xs env di-local-npm-registry.
2. Copy the path shown in the 'storage-path'. It should look similar to this example:
/usr/sap/hana/shared/XSA/xs/controller_data/fss/
a44ae1be-8fa5-4470-b08a-db0begfs8f9f
3. Run your command-line session as root user and change directory to the storage path you
retrieved from the registry.
4. Search the SAP storage directory by rst changing directory again and then using the find
command:
cd storage/@sap
find
Related Information
SAP Web IDE for SAP HANA - Installation and Upgrade Guide
SAP HANA Developer Guide for SAP HANA XS Advanced Model
3.9 Troubleshooting BW on HANA
This section identies some of the common problem areas for users of Business Warehouse on HANA and
points to existing information sources which will help to resolve the issues.
Documentation
All public documentation related to BW on HANA can be found in the SAP Help Portal on the SAP Business
Warehouse product page. In the SAP Community Network (SCN) you can nd a complete end-to-end
SAP HANA Troubleshooting and Performance Analysis Guide
Root Causes and Solutions
PUBLIC 137
collection of detailed BW on HANA related information including presentations, blogs, discussions, how-to
guides, release information, videos, roadmap and so on. An internal WIKI page is also available with additional
information on BW on HANA troubleshooting:
• SAP Help Portal: SAP Business Warehouse, powered by SAP HANA.
• SAP Support Community: SAP Business Warehouse on SAP HANA and HANA SQL-based Data
Warehousing.
• WIKI: BW on HANA Documentation and Troubleshooting
This chapter refers to the transaction codes which are used to access each BW function, such as RSRT for the
Report Monitor and RSRV for Analysis and Repair of BW Objects. RSA1 is the Data Warehousing Workbench
which is the central cockpit used for the administration of almost the entire BW system. A list of the most
commonly-used transaction codes is given in a table at the end of this chapter: Frequently-used Transaction
Codes.
Table Redistribution
BW on HANA Table Redistribution ensures that the tables of a BW system are partitioned correctly according
to the SAP recommendations and, in the case of a scale-out system, are dened on the correct database
nodes. This is important for the optimal performance of the system.
Refer to the following for details of how to congure table redistribution:
• SAP Note 1908075 - BW on SAP HANA: Table placement and landscape redistribution.
• KBA: 2517621
- After landscape redistribution data does not appear evenly distributed between the
slave nodes in terms of memory usage per a HANA node.
• Guided answer How to carry out preparations for a table redistribution for BW with a step-by-step
description of how to congure the table redistribution.
If the table placement and table redistribution are done correctly there should be no requirement to make
manual changes to the partitioning for BW tables. The expected partitioning for BW objects and associated
tables is described here:
• KBA 2044468 - FAQ: SAP HANA Partitioning (question 17: How should tables be partitioned in BW
environments?)
• SAP Note 2019973 - Handling Very Large Data Volumes in SAP BW on SAP HANA
Two Billion Record Limit
Tip
It is not possible to partition BW master data SID tables. Irrespective of the underlying database, SID tables
of master data InfoObjects already have the upper limit value of 2 billion records imposed by the datatype
of the SIDs (INT4). A detailed explanation on this topic and what can be done to avoid this limitation is
available in the SAP Note 1331403 - SIDs, Number Ranges and BW InfoObjects.
It is possible to proactively monitor the 2 billion table or partition limit on HANA using the SAP EarlyWatch Alert
Workspace in the SAP ONE Support Launchpad. Using this application, you get an overview of which tables
are approaching the limit including a prediction of when the limit will be reached, broken down into a mean,
138
PUBLIC
SAP HANA Troubleshooting and Performance Analysis Guide
Root Causes and Solutions

best-case and worst-case scenario. By default, the forecast is based on all previous measurements. You can
nd details in the following blog post:
• The New 2 Billion Record Limit in the SAP EarlyWatch Alert Workspace .
Checking Consistency with RSDU_TABLE_CONSISTENCY
For BW on HANA systems you can use the ABAP report RSDU_TABLE_CONSISTENCY to check that the table
placement is correct and that the BW objects are located on the correct HANA nodes. A user document for the
report is attached to the SAP Note 1937062 - Usage of RSDU_TABLE_CONSISTENCY.
A practical example of where this report can be useful is around DSO activation performance issues. If the
DSO activation is in a distributed HANA environment and it takes longer than expected, you should check if the
partitioning of DSO tables (Active Data, Activation Queue and Change Log tables) is consistent, that is, same
partitioning and same hosts for the related partitions.
The RSDU_TABLE_CONSISTENCY report is only available in BW on HANA systems and not in the next-
generation data warehouse product BW/4HANA where most of the checks made by the report are obsolete.
Some checks made by the report that are still required will move to transaction RSRV - see the following
subsection and also Analysis and Repair Environment in the NetWeaver section of the SAP Help Portal.
Consistency Checks with RSRV Transaction
RSRV consistency checks (Analysis and Repair Environment) are part of the BW application. In the analysis
and repair environment you can perform consistency checks on the data and metadata stored in a BW system.
The main purpose of this is to test the foreign key relationships between the individual tables of the enhanced
star schema of the BW system. These checks can be useful to solve problems in BW on HANA environments if
you are getting unexpected data results. BW application inconsistencies can also cause errors when converting
standard InfoCubes to SAP HANA-optimized InfoCubes, the RSRV checks can be used to nd and resolve
these inconsistencies. See SAP NetWeaver modeling documentation: Converting Standard InfoCubes to SAP
HANA-Optimized InfoCubes.
Delta Merge
The implementation and operation of a SAP BW on HANA system requires a solid understanding of the delta
merge process in the database. Understanding this will allow administrators to optimize data loading and can
in some cases help improve the performance of BW on HANA queries. Delta merge processing can consume
a signicant amount of system resources especially for large tables and therefore needs to be understood to
manage any system powered by SAP HANA. For more information please see:
• For details of delta merge conguration for BW: Triggering a Delta Merge (SAP BW/4HANA).
• For information on troubleshooting delta merge: KBA 2057046
- FAQ: SAP HANA Delta Merges
SAP HANA Troubleshooting and Performance Analysis Guide
Root Causes and Solutions
PUBLIC 139
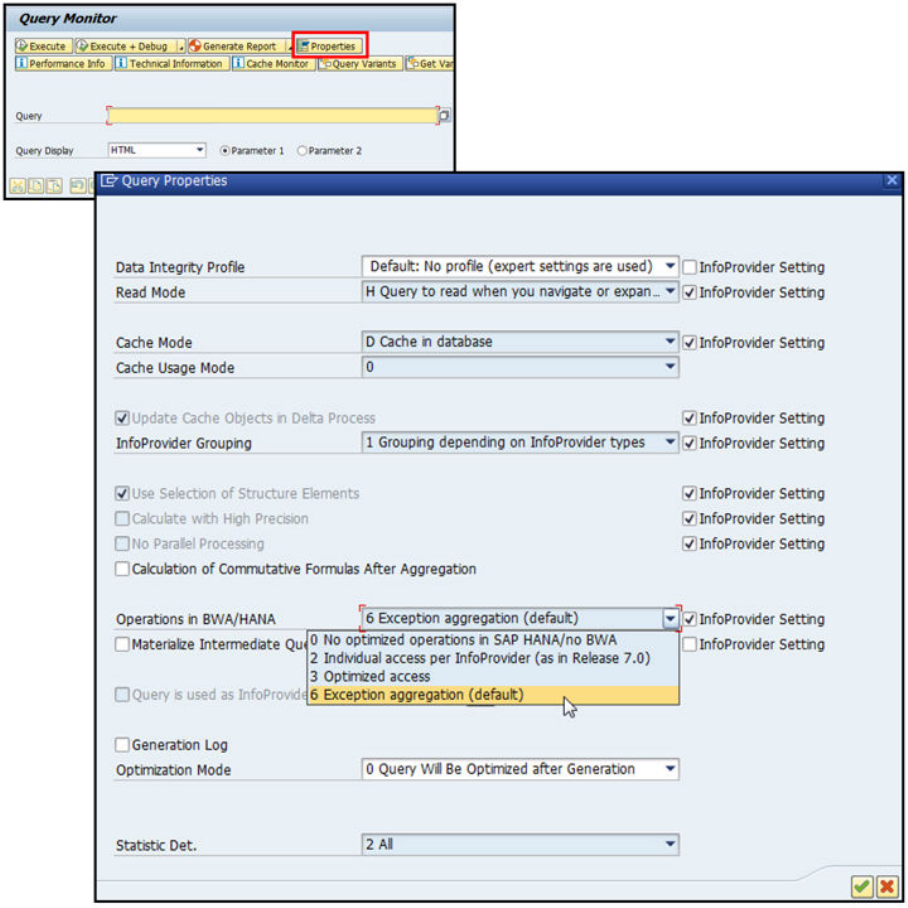
Query Execution Modes (RSRT)
For query execution BW always checks if optimized operations can be pushed down to the HANA database, the
four available execution modes can be seen in RSRT from the query properties:
In some cases, especially where there is no support for push down of BW functionality to HANA Database
or where you get an error or have a performance problem with HANA operation modes (TREXOPS=6 or
TREXOPS=7 or TREXOPS=8) it can make sense to use operation mode 0 (No optimized operations in SAP
HANA/no BWA) at least as a workaround to execute the query.
Not all BW queries will benet from the HANA operation modes that push down BW functionality to the HANA
Database. The benet depends on the exact query denition and the data in the providers. Therefore, where
the runtime of the query is critical it is necessary to test the impact of this feature on the performance of every
single query and then choose the proper query operation mode.
140
PUBLIC
SAP HANA Troubleshooting and Performance Analysis Guide
Root Causes and Solutions

For more information please see:
• For more details on the operation modes: NetWeaver Generic Tools and Services documentation:
Operations in SAP HANA / BWA
• For more detail on the process logic, the SAP Community Wiki: Query Property: Operations in HANA BWA
(TREXOPS) .
• For a list of the functionality that is currently pushed down to HANA, refer to the SAP Note 2063449 -
Push down of BW OLAP functionalities to SAP HANA.
• For information on testing the benets of pushdown: 2365030 - Bex Query slower with HANA
pushdown.
Performance Issues
There is often the expectation after a BW on HANA migration from another database that all BW queries should
be much faster. Of course, if the query was slow already before database migration to SAP HANA due to some
calculations happening on the BW application server and these calculations cannot be pushed down to the
HANA database then HANA cannot help in these cases; a redesign of the BW query will be necessary.
The query run time component that we can expect to see signicantly improved with SAP HANA is the
database time, this is the Event ID 9000 (Data Manager Time) in the BW Query run time statistics. What we
can possibly improve with HANA, apart from the database time, is the time spent in the Analytic Manager.
The Analytic Manager in BW (previously known as the OLAP engine) is the brain of BW when it comes to BW
query processing, so it is responsible for navigation, ltering and aggregation among other things in the query
execution. For additional information here please refer to the following KBA:
• 2122535
- How to determine if a BW on HANA query performance problem is HANA database related.
Before starting performance troubleshooting on HANA we rst need to identify if there is a general
performance problem for the BW on HANA system or if the problem is just for one BW query or report.
For information on the steps to verify this, troubleshoot the issue and collect the required logs and traces refer
to the HANA WIKI:
• Troubleshooting HANA Performance issues
.
Plan Viz Trace Generated in RSRT
RSRT can be used to check Business Explorer (BEx) queries. The benet of using RSRT to check a BW query is
that it is independent of the client frontend, so you can eliminate the client frontend tool (Bex, BI frontend tool
etc) from the problem analysis. If the issue can be reproduced in RSRT then the issue is not related to the client
frontend.
Transaction RSRT provides several debug features that are helpful when analyzing a BW query. With BW
on HANA, queries are usually executed on the HANA database using stored procedure TrexViaDbsl or
TrexViaDbslWithParameter. The call of procedure TrexViaDbsl(withParameter) can be displayed in RSRT if
the Debug ag Python Trace or Plan/Performance Trace is set on BW740 systems or Generate Plan Viz File
on BW750 systems. You can copy this call and use it in SAP HANA Studio to execute Plan Viz to check the
execution plan.
Prerequisites: at least BW 740 SP13 and HANA 1.0 SPS 11
SAP HANA Troubleshooting and Performance Analysis Guide
Root Causes and Solutions
PUBLIC 141

Refer to the Wiki as follows:
• For basic information on transaction RSRT: Query Monitor .
• For the detailed steps on how to do this: BWonHana: PlanViz Trace generated in RSRT .
It is often the case that performance issues for individual BW queries can be resolved with hints. For details of
hints refer to the KBA 2142945 - FAQ: SAP HANA Hints:
• Question 4. What important hints are related to SAP HANA?
• Question 3 How can hints be specied? (describes how the hints can be set on the BW application level).
Composite Provider
One of the most used InfoProviders for BW on HANA reporting is the composite provider which can be created
using the BW Modeling tools. These tools provide a new development environment for editing BW metadata
objects. The development environment is based on the SAP HANA Studio. For more information refer to the
following blog:
• SAP BW Modeling tools: Three things to know when using the BW modeling tools in Eclipse
A Composite Provider is an InfoProvider in which you can combine data from BW InfoProviders such as
InfoObjects, DataStore Objects, SPOs and InfoCubes, or SAP HANA views such as Analytical or Calculation
Views using join or union operations to make the data available for reporting.
To avoid performance issues with BW queries created on the composite provider, especially related to the
use of joins or navigation attributes, it is important that the composite provider is modeled based on the
information in the following SAP Notes:
• 2271658 - Design Considerations for Composite Provider
• 2103032 - Long runtimes in query on Composite Provider
Advanced DSO
The end goal for the advanced DSO (ADSO) is to be the central persistency object in BW-on-HANA replacing
the InfoCube, classic DSO, HybridProvider and PSA. While there are still some gaps to cover the complete
functionality, we recommend considering the advanced DSO for all new projects as the central (and only)
persistency object.
Additional information on the ADSO can be found in the following:
• SCN blog post The "advanced” DataStoreObject – renovating BW's persistency layer
• SAP Note 2070577 - (advanced) DataStore Object - availability in BW7.4 SP08, SP09 and SP10
To avoid data loading or reporting performance problems related to ADSO please implement the
recommendations and corrections from the following SAP Notes:
• 2185212 - ADSO: Recommendations and restrictions regarding reporting
• 2684950 - 750SP14: Performance problems during access of DTP with source as ADSO
• 2374652 - Handling very large data volumes with advanced DataStore objects in SAP BW on SAP HANA
and BW/4HANA
142
PUBLIC
SAP HANA Troubleshooting and Performance Analysis Guide
Root Causes and Solutions

Column Views
After you migrate a BW system to a BW on SAP HANA Database all InfoProviders and InfoObjects must have
column views which are needed for reporting. In case a new BW InfoProvider or InfoObject is created, the
associated column view is generated during activation on the SAP HANA database. If column views do not exist
or are inconsistent, the associated BW queries based on the view may fail.
Problems with column views on SAP HANA can often be resolved by recreating the column view for
the associated InfoProvider, this can be done using the report RSDDB_LOGINDEX_CREATE. For further
information refer to the following SAP Notes:
• KBA 2106851 - Column Store Error 2048 executing RSDDB_LOGINDEX_CREATE on Multiprovider - on
symptoms related to these issues and how to use the report to resolve them.
• SAP Note 1695112 - Activities in BW after migrating to the SAP HANA database for possible root causes
for HANA view inconsistencies especially after the database migration to HANA.
You can use the report RSDDB_INDEX_CREATE_MASS to generate views for more than one InfoProvider.
Further information can be found in the Wiki:
• BWonHANA: InfoProvider column views .
Authorization issues related to BW on HANA Generated views
To ensure that you have the required permissions to access views and data related to BW on HANA please
follow the conguration steps in the following:
• Help Portal: Authorizations for Generating SAP HANA Views.
• SAP BW∕4HANA: Generating SAP HANA Views from the SAP BW∕4HANA System
If after doing the above conguration you still get an authorization related error when accessing the BW
generated view on HANA you can nd the missing privilege(s) using the information in SAP Note: 1809199
-
SAP HANA DB: Debugging user authorization errors.
Cross-Database Access for BW Calculation views
Read-only queries between tenant databases in the same SAP HANA system are also possible for BW
calculation views. This means that database objects such as tables and views can be local to one database
but be read by users from other databases in the same system.
The conguration that is required on the HANA Database side is described in the SAP HANA Administration
Guide under the section Cross-Database Access. For this to work with BW on HANA generated views an
additional conguration step is required. This BW side conguration for the BW External HANA View is
described in the following SAP note (see question 8 'External HANA View'):
• 2312583 - FAQ: BW and HANA MDC: Cross-Database-Access in HANA Multitenant Database Containers.
For the External HANA View, a dedicated setting is available to support the read access from a remote tenant
database via HANA Cross-Database-Access (CDA) based on MDC. If the ag is set, then the request handling
SAP HANA Troubleshooting and Performance Analysis Guide
Root Causes and Solutions
PUBLIC 143
is de-activated for the external SAP HANA views. This is required as the request handling is implemented in
procedures because HANA CDA does not support embedded procedures in remote views.
Further information can be found in the context help of BW transaction RS2HANA_ADMIN General
Settings Multi-tenant enabled Additional limitations for cross-database access are described in the
following SAP note:
• 2196359 - Limitations for cross-database access in an SAP HANA MDC environment.
Privilege Errors
A privilege error may occur for a user trying to do a data preview or access a view in the remote database:
[258]: insufficient privilege: Detailed info for this error can be found with
guid '<some GUID>'
See Troubleshooting Authorization Problems [page 156] in this guide for how to use the GUID value to nd out
which privileges are missing.
Or an authorization error may occur:
User <USER NAME> is not authorized to use VIEW _SYS_BIC.<package>/<view_name>
because of missing grantable privileges on underlying objects
The most likely root cause of these errors is that the user does not have SELECT privilege on the bottom
column view WITH GRANT OPTION. For a particular user to be able to select from a view (independent of
whether this is an activated column view modeled through the SAP HANA Modeler or a SQL view that was
created manually), the view owner needs the SELECT privilege on all underlying objects WITH GRANT OPTION.
In a cross-database setup, the remote user that is mapped to _SYS_REPO on the tenant database that created
the top calculation view will usually not have this privilege. See also point 6 of the solution in the following SAP
note:
• 2196359 - Limitations for cross-database access in an SAP HANA MDC environment.
Further background information on this privilege requirement can be found in the following:
• SAP HANA Security Guide: Cross-Database Authorization in Tenant Databases (in the section Cross-
Database Authorization in Tenant Databases)
• The 'Cause' section of KBA 2787578 Running a HANA view fails with error "User _SYS_REPO is not
allowed to grant privilege SELECT for TABLE"
Consumption of External BW HANA Views for BW InfoProviders in XSA
WebIDE and Required Privileges
If you want to use BW external HANA views in your modeling in WebIDE then you need to assign certain
privileges for this to work. If you don’t do this then the creation of the native views and/or querying the native
views in WebIDE will fail with an "insucient privilege" error such as:
Error: (dberror)[258]:insufficient privilege: search table error: [2950]
exception 306003:
Authorization failed in Calculation Engine. User is not authorized to
'SELECT'.
144
PUBLIC
SAP HANA Troubleshooting and Performance Analysis Guide
Root Causes and Solutions

The required privileges are:
• The HDI container owner (technical user with sux "#OO") needs SELECT WITH GRANT OPTION on the
relevant BW views.
• The application user needs analysis authorization (Analytic Privileges) on the relevant BW views.
See also SAP note 2907570 - Consumption of external HANA views for BW InfoProviders in XSA WebIDE
database modules. Attached to this SAP note is a template ABAP report ZRS2HANA_CREATE_XSA_ROLES that
you can use to assign the required privileges and a detailed document that has step-by-step information and
examples on how to use the report.
Data Loading, Sizing and Memory Usage
After a BW on HANA migration if you experience high memory usage or OOM dumps on HANA during data
loading using Data Transfer Process or info package please check if the below SAP Notes are applicable in your
case and applied in your system if relevant:
• 2230080 - Consulting: DTP: Out of memory situation during 'SAP HANA Execution' and the 'Request by
Request' Extraction
• 2402503
- Increased memory requirement of BW objects in SAP HANA
• 2602477 - Considerations for packagewise extraction from HANA DataSource based on Calculation
Views
If you experience high loads and unloads of column store tables as described in the KBA 2127458 - FAQ: SAP
HANA Loads and Unloads the sizing of the system should be checked.
You can use the program /SDF/HANA_BW_SIZING to size the system either before the database is migrated
to HANA to get an estimation of the required hardware and memory requirements, or after the migration
when the database is running on HANA to check if the sizing of the BW on HANA system is correct. Further
information on the usage of this program is available in the following SAP note:
• 2296290 - New Sizing Report for SAP BW/4HANA.
To get an overview of the current memory usage in the HANA system you can use the script
HANA_Memory_Overview_1.00.90+.txt from the KBA 1969700 - SQL Statement Collection for SAP HANA,
the script shows the size of the row and column store tables and also the size of the HANA memory HEAP
allocators.
Background information, for example, to understand the purpose of the HEAP allocator and to understand
what can be done to reduce the memory consumption for the HEAP allocator, can be found in the following
SAP note:
• 1999997 - FAQ: SAP HANA Memory, (question 13: What can I do if a certain heap allocator is unusually
large?)
For information on how to do housekeeping for large BW on HANA row store tables refer to the information in
the following KBA:
• 2388483
- How-To: Data Management for Technical Tables.
SAP HANA Troubleshooting and Performance Analysis Guide
Root Causes and Solutions
PUBLIC 145
Wrong Data
As a rst step to analyze wrong data or unexpected results, the issue should be checked from the BW
application side using the steps given in the BW application KBAs:
• 2271335 - Wrong Data is Read from a HANA InfoProvider,
• 2399752 - Dierent Results with Operations Mode in BWA/HANA (TREXOPS) in a BW Query
• 1508237 - First Steps to Check Wrong Number in BW Query (Transaction RSFC).
Additionally, all known reasons why the HANA database could return wrong or unexpected results are
explained in the following SAP HANA KBA:
• 2222121 - SAP HANA Wrong Result Sets
Frequently-used Transaction Codes
The following table lists (in alphabetical order) the most often used transaction codes when working in a BW on
HANA system:
Tcode
Description
AL11 SAP Directories, you can nd trans log under DIR_TRANS, work process log under
DIR_HOME, etc. It’s useful when you don’t have authorization to run st11
DB01 Display blocked transactions, you can nd the same information under DBACOCKPI-
>Diagnostics->Locks->Blocked Transactions
DB02 Display Consistency Check result, help you to nd out missing objects in database,
unknown objects in ABAP. Index checks etc. It will display the same interface as
DBACOCKPIT/ST04->Diagnostics->Missing Tables and Indexes
DBCO Maintain secondary Database connections
LISTCUBE List content of an Info Cube
OS01 LAN Check by Ping, can check the connectivity between DB server and Application server
RS2HANA_CHECK Check all prerequisites for successful replication of BW authorizations to SAP HANA, it can
be used to check if the BW users has authorization to run the HANA views generated from
the BW model
RS2HANA_ADMIN It can be used as a general entry point where all BW objects with enabled "External SAP
HANA View" are visible.
RSA1 Data Warehousing Workbench (>= BI 7.0) / Administrator Workbench (< B I 7.0), The
administrator workbench is the central cockpit used for the administration of almost
the entire BW system. The RSA1 main screen can be divided into three general areas.
The extreme left area, allows us to choose BW modelling components like Infoproviders,
146 PUBLIC
SAP HANA Troubleshooting and Performance Analysis Guide
Root Causes and Solutions
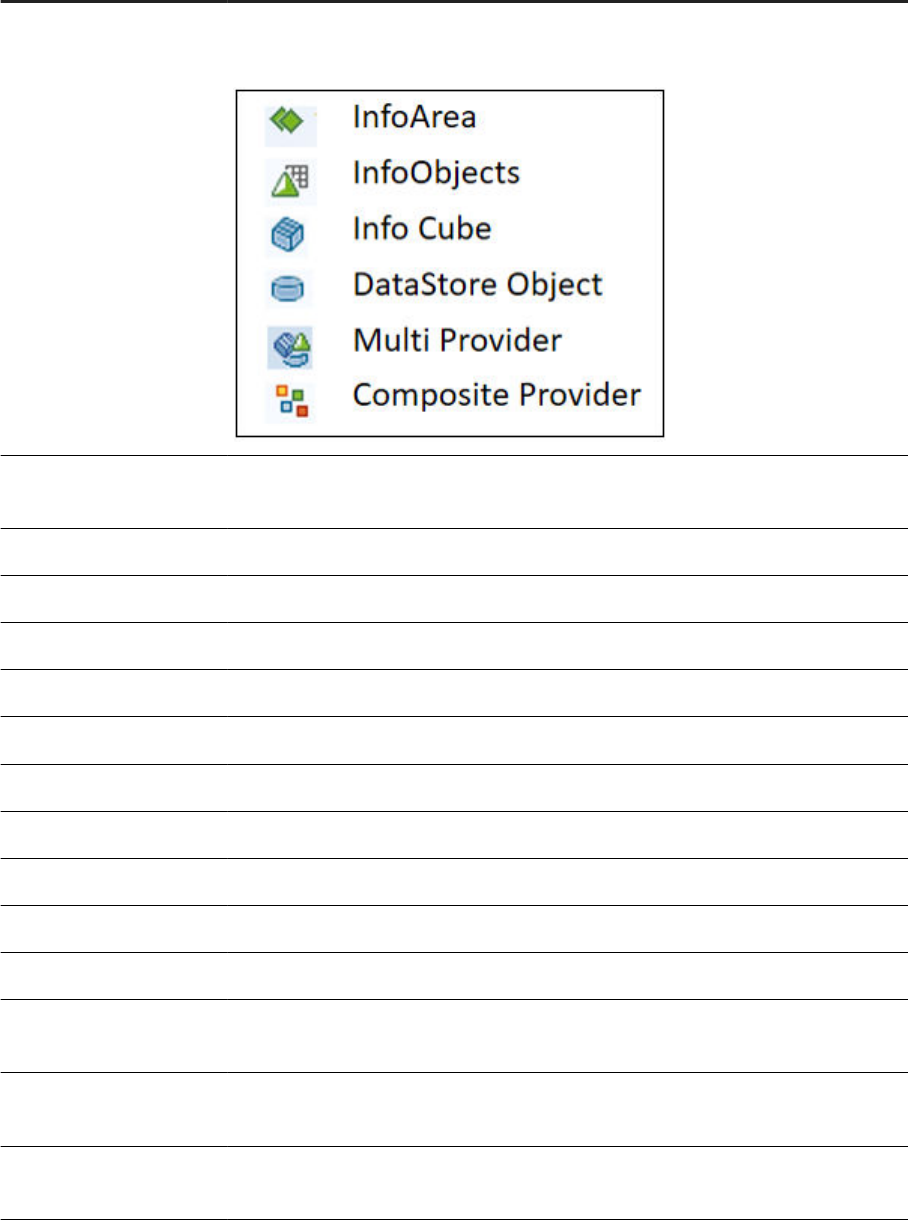
Tcode Description
InfoObjects, InfoSources and DataSources. Individual BW components represented by
dierent icons:
RSD1 Characteristic maintenance, For issues like InfoObjects cannot be activated, you can use
this tcode to activate the infoObjects again to reproduce the issue.
RSDDB SAP HANA/BWA index maintenance,
RSLIMOBW Create/modify Composite Provider
RSPC Process Chain Maintenance, can be used to nd the process chain job logs
RSRQ Data Load Monitor for a Request
RSRT Start of the report monitor, can be used to run Bex queries.
RSRV Analysis and Repair of BW Objects, can be used to check BW Object consistency.
RSTT RS Trace Tool
RZ11 List ABAP prole parameters
SAINT SAP Add-on Installation Tool
SPAM SAP Patch Manager
SE01 Transport Organizer Tool, for issues related to BW transports, can be used to nd the
related transports and nd the transport log
SE11 ABAP Dictionary, display the ABAP table/view denition, can be used to nd the primary
index denition as well
SE14 ABAP Dictionary Database Utility, can be used to check if ABAP table exist on DB level,
recreate table etc.
SAP HANA Troubleshooting and Performance Analysis Guide
Root Causes and Solutions
PUBLIC 147
Tcode Description
SE16 Display content of an ABAP table/view
SE38 ABAP Editor, can be used to display/run ABAP programs. If only need to run the ABAP
program, can use SA38 instead. Useful ABAP program:
• RSDU_TABLE_CONSISTENCY
• RSDDB_LOGINDEX_CREATE
• RSDDB_MASS_INDEX_CREATE
• RS_BW_POST_MIGRATION
• RS2HANA_AUTH_RUN
• RSPFPAR – Display prole parameter
• ADBC_TEST_CONNECTION -- test if the DB connection works
•
RSDU_EXEC_SQL – if SQL editor is not available through DBACOCKPIT
•
RSBDCOS0 -- run an OS command
•
RSTRC000 – lock a SAP work process for yourself, and increase work process trace
level
SLG1 Analyze Application log. It is useful to get the logs and timestamps for errors on application
side
SM04 Display all the current ABAP user sessions
SM12 Display and Delete Locks on ABAP level
SM21 Online System Log Analysis
SM37 Overview of BW scheduled jobs, for a failed job, you can view the job log and from the job
details you will be able to nd which work process has been used to run the job.
SM50 Work Process Overview
SM51 List of SAP Systems, it’s useful to switch to dierent application servers
SM59 RFC Destinations (Display/Maintain)
SM66 Global work process Monitor, list all the active work processes on the system
SNOTE Check if SAP Note being implemented on the system or not
ST05 Enable SQL trace, which will help you to tell which query cause the long running time.
ST06 Operating System Monitor
ST11 Check work process log
ST03 Work load monitor
ST04 DBACOCKPIT-> DB overview
148 PUBLIC
SAP HANA Troubleshooting and Performance Analysis Guide
Root Causes and Solutions

Tcode Description
ST12 Single Transaction analysis, only available if the SAP ServiceTools has been
installed(component ST-A/PI. SAP Note 69455). It’s a combination of the standard
ABAP(SE30) and SQL trace(ST05) see SAP Note 755977 for step-by-step instructions
ST22 ABAP Runtime Error
SU01 User maintenance, display/Modify BW users
3.10 Troubleshooting Multi-Dimensional Services Queries
This section describes how to execute, capture and analyze InA queries for SAP Analytics Cloud (SAC) HANA
Multi-Dimensional Service.
Introduction
SAP Analytics Cloud’s query language is called InA (Information Access). InA queries are executed using HANA
Multi-Dimensional Service and the result set is returned to SAC front-end for rendering.
InA queries are expressed in JSON which is not designed for human consumption but it is a text format which
can at least be read by humans. To analyze an InA query for troubleshooting purposes you can record the query
execution using the browser’s development tools and save the query as a le. You can then execute the query in
isolation using the EXECUTE_MDS procedure call and analyze the execution plan using visualization tools.
A similar approach can be used for other applications such as Analysis Oce and Lumira Designer, but in these
cases the third-party tool Fiddler is required.
This section describes how to execute, capture and analyze InA queries in this way and includes an overview of
using Fiddler for Analysis Oce:
• How to capture InA queries
• How to execute InA queries and visualize the execution plan
• How to execute multiple InA queries in parallel
• Debugging Analysis Oce InA queries
More Information
For a general introduction to MDS and frequently-asked questions which may also help with troubleshooting,
refer to the SAP Note 2670064 - FAQ: SAP HANA Multi-Dimensional Services (MDS). For details of diagnosis
data required by SAP Support refer to SAP Note 2691501 - SAP HANA MDS: Information needed by
Development Support.
Other SAP Notes related to MDS include:
• 2550833 - HANA built-in procedure: EXECUTE_MDS
SAP HANA Troubleshooting and Performance Analysis Guide
Root Causes and Solutions
PUBLIC 149
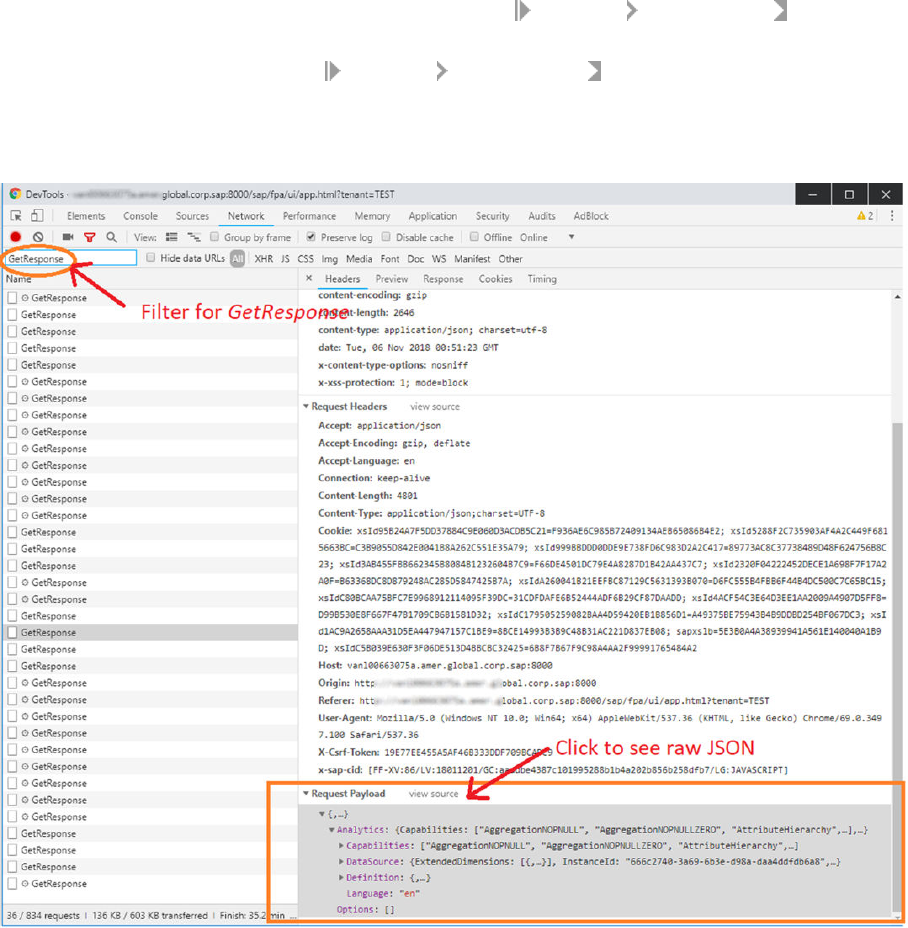
• 2773755 - Guideline for Controlling Server Load with InA/MDS Analytic Requests
How to Capture InA Queries
You can capture InA queries issued by SAC using the browser’s development tools, the following steps and
examples are illustrated using Google Chrome.
1. Start the Chrome debugging tool by one of the following methods:
• From the Customize and Control Google menu, choose More tools Developer tools (shortcut key
Ctrl+Shift+I).
• From the menu bar select View Developer Developer tools (shortcut key F12).
2. From the panel and console which is opened select the Network tab.
3. Navigate to the problematic page in SAC and when the debug screen has loaded lter for GetResponse as
shown here:
To save the network capture:
1. Look for the Record button on the toolbar of the Network tab. It should be red. If it is gray, click it once to
start recording.
150
PUBLIC
SAP HANA Troubleshooting and Performance Analysis Guide
Root Causes and Solutions
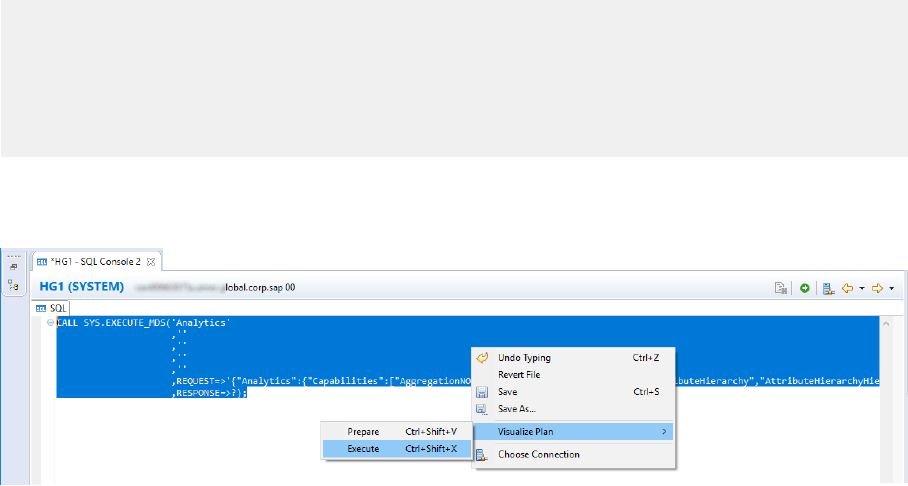
2. Check the Preserve log checkbox on the toolbar.
3. Click the Clear button to clear out any existing logs from the Network tab.
4. Now try to reproduce the issue that you want to analyze while the network requests are being recorded.
5. Once you have reproduced the issue, right click on a grid line with gray background on the grid of network
requests and select Save as HAR with Content, and save the le to your computer. This HAR le can be
reopened to analyze and replay the InA queries within.
How to Execute and Visualize InA Queries
InA queries can be individually executed as described here. To execute an InA query the SAC user must have
the role INA_ROLE. If the customer is using a technical user to execute InA queries, then the role must also be
assigned to the user who wants to troubleshoot the issue.
1. Open the SQL Console in Web IDE (or any other console such as SAP HANA studio).
2. Call built-in stored procedure SYS.EXECUTE_MDS with the InA query that was previously captured as the
REQUEST parameter. Both REQUEST and RESPONSE are in JSON format (data type NCLOB):
CALL SYS.EXECUTE_MDS('Analytics'
,''
,''
,''
,''
,REQUEST=>'{"Analytics"…'
,RESPONSE=>?);
It is possible to render the RESPONSE into a tabular format, but it is not needed for performance analysis.
1. You can now visualize the execution plan of an InA query by invoking the menu actions shown below:
SAP HANA Troubleshooting and Performance Analysis Guide
Root Causes and Solutions
PUBLIC 151
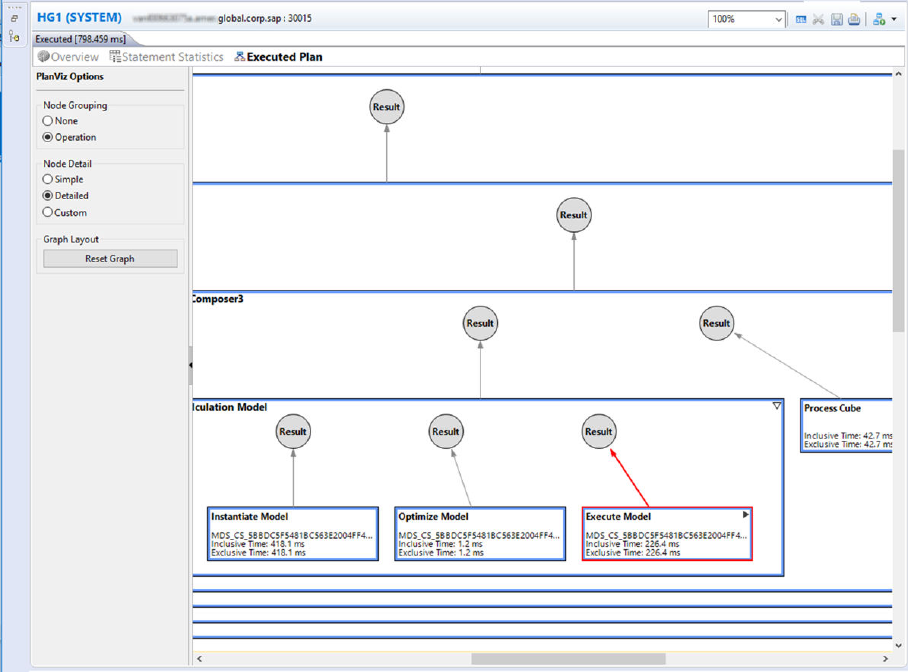
The result of visualization depends on the query, but it resembles a SQL query visualization plan as shown
below:
The execution of each step of the plan is identied in this graph. If Execute Model is expanded, it will eventually
lead to column store operations that are used to fetch the data from source tables. This method can be used to
evaluate the performance of model with respect to the InA queries issued by SAC.
If most of the time is spent in Process Cube and/or Prepare Query, then it is possible that the bottleneck
is in MDS engine (see related topics in the SAP HANA Performance Guide for Developers). But if most of
the execution time is spent in Execute Model, then the bottleneck is most probably in the way the model is
designed.
The use of workload classes to apply workload settings for your application may be one way of improving
performance. If, for example, a single execution of a query in isolation does not take a lot of resources,
but there is a degradation in performance in a production environment where many queries are executed
simultaneously, a workload class and mapping could be used to manage the allocation of resources. This could,
for example, apply a higher priority to the query or apply resource limitations on other queries.
How to Execute Multiple InA Queries in Parallel
SAC stories contain visualizations and each visualization requires at least one InA query. The InA queries in a
story are executed in parallel which will cause more load on a customer’s HANA machine and which may lead
to performance degradation.
152
PUBLIC
SAP HANA Troubleshooting and Performance Analysis Guide
Root Causes and Solutions

Customers can test their HANA machine and the model’s performance by opening multiple connections and
executing multiple InA queries at once using the EXECUTE_MDS procedure explained above.
Analysis Oce InA Queries
A similar approach to that described above for SAC can be used to collect InA queries for Analysis Oce and
Lumira Designer using Fiddler; Fiddler is a freely-available third-party troubleshooting tool that can trace web
trac activity. Once Fiddler is installed you can open the application where the issue occurs and reproduce the
problem. The query and response are then visible and, if necessary, you can save these and send them to SAP
Support for analysis. Refer to the following SAP Notes for more details:
• How to download, install and run Fiddler is described in SAP Note 1766704 How to use Fiddler to collect
HTTP and HTTPS traces.
• Details of the procedure to extract the query can be found in SAP Note 2839059 How To Extract Ina Json
Query and Response from Fiddler Traces.
Related Information
SAP Note 2691501
SAP Note 2550833
SAP Note 1766704
SAP Note 2839059
SAP Note 2773755
Query Execution Engine Overview
Using "Execute in SQL Engine" in Calculation Views
3.11 License Issues
This section covers license-related issues.
Related Information
System Locked Due to Missing, Expired, or Invalid License [page 154]
License Problem Identication and Analysis [page 154]
Resolution of License Issues [page 155]
SAP HANA Troubleshooting and Performance Analysis Guide
Root Causes and Solutions
PUBLIC 153

3.11.1System Locked Due to Missing, Expired, or Invalid
License
New installations of SAP HANA are equipped with a temporary license that expires after 90 days. To keep the
system functional after this period, you have to install a permanent license.
Improper licensing may lead to a lockdown of your SAP HANA system. In this case, the only allowed action is to
install a valid license.
The system goes into lockdown in the following situations:
• The permanent license key has expired and either:
• You did not renew the subsequently installed temporary license key within 28 days, or
• You did renew the subsequently installed temporary license key but the hardware key has changed
• The installed license key is an enforced license key and the current memory consumption exceeds the
licensed amount plus the tolerance.
• You deleted all license keys installed in your database.
For more information, see Managing SAP HANA Licenses in the SAP HANA Administration Guide.
Related Information
Managing SAP HANA Licenses
3.11.2License Problem Identication and Analysis
The rst signs of problems related to licensing will be visible by Alert 31 or Alert 44 being issued.
You can check your current license using the SAP HANA cockpit: Choose the Manage system licenses link on
the Overview page.
Alternatively, you can retrieve the same information using SQL:
SELECT * FROM M_LICENSE;
Note
To be able to query license information, you must have the system privilege LICENSE ADMIN.
The M_LICENSE system view includes the following information:
• License data:
• SID
• Hardware key
• Installation number
• System number
154
PUBLIC
SAP HANA Troubleshooting and Performance Analysis Guide
Root Causes and Solutions
• Product limit (licensed amount of memory)
• Validity start date
• Expiration date - See SAP Note 1899480 - How to handle HANA Alert 31: 'License expiry'
• Last successful check date
• License status (permanent, valid, enforced, local) See SAP Note 1899511 - How to handle HANA Alert 44:
'Licensed Memory Usage'
Note that in case of system lockdown, only SID and hardware key are displayed. Information on previously
installed licenses is available.
SAP HANA licenses can be installed for the system database (global) or for a single tenant database (local).
Global licenses are for the system database and all tenants but a license installed in a tenant will govern only
the tenant. If the license is installed incorrectly at the local level you can remove the tenant-specic license key
to revert the license validity to the global license key installed in the system database.
Related Information
M_LICENSE System View
SAP Note 1899480
SAP Note 1899511
3.11.3Resolution of License Issues
If your license becomes invalid, you need to install a new license.
You can install a new license either in the SAP HANA cockpit or using SQL.
Note
To install a license key, you need the LICENSE ADMIN system privilege.
You install a license key with the following SQL statement:
SET SYSTEM LICENSE '<license file content goes here, line breaks matter>';
Note
Line breaks are essential for interpretation of the license key text, hence they must not be removed. If
you use the command line tool SAP HANA HDBSQL to install the license, make sure to enable multi-line
statement support (command line option -m or \mu ON when within SAP HANA HDBSQL).
The command will fail if the license key has a dierent installation number or system number than the current
ones in the database instance. If you have successfully installed a license but your system is still locked down,
check the following:
• The current system time is within the validity period of the license.
• Your installed license key is correct, in particular, the M_LICENSE view displays only one row with a valid
license for the product SAP HANA.
SAP HANA Troubleshooting and Performance Analysis Guide
Root Causes and Solutions
PUBLIC 155

• The SAP Notes in the Related Links section.
For more detailed information about how to install a license key, see the SAP HANA Administration Guide.
Related Information
SAP Note 1704499
SAP Note 1634687
SAP Note 1699111
Managing SAP HANA Licenses
Run Long Commands in Multiple-Line Mode
3.12 Security-Related Issues
This section looks at issues related to authorization and authentication.
Related Information
Troubleshooting Authorization Problems [page 156]
Troubleshooting Problems with User Name/Password Authentication [page 162]
Troubleshooting Problems with User Authentication and SSO [page 164]
3.12.1Troubleshooting Authorization Problems
SAP HANA implements its authorization concept based on the entities user, privilege, and role.
General Analysis
The system view EFFECTIVE_PRIVILEGES is useful for checking the privileges of a specic user. It includes
information about all privileges granted to a specic user (both directly and indirectly through roles), as well as
how the privileges were obtained (GRANTOR and GRANTOR_TYPE column).
156
PUBLIC
SAP HANA Troubleshooting and Performance Analysis Guide
Root Causes and Solutions
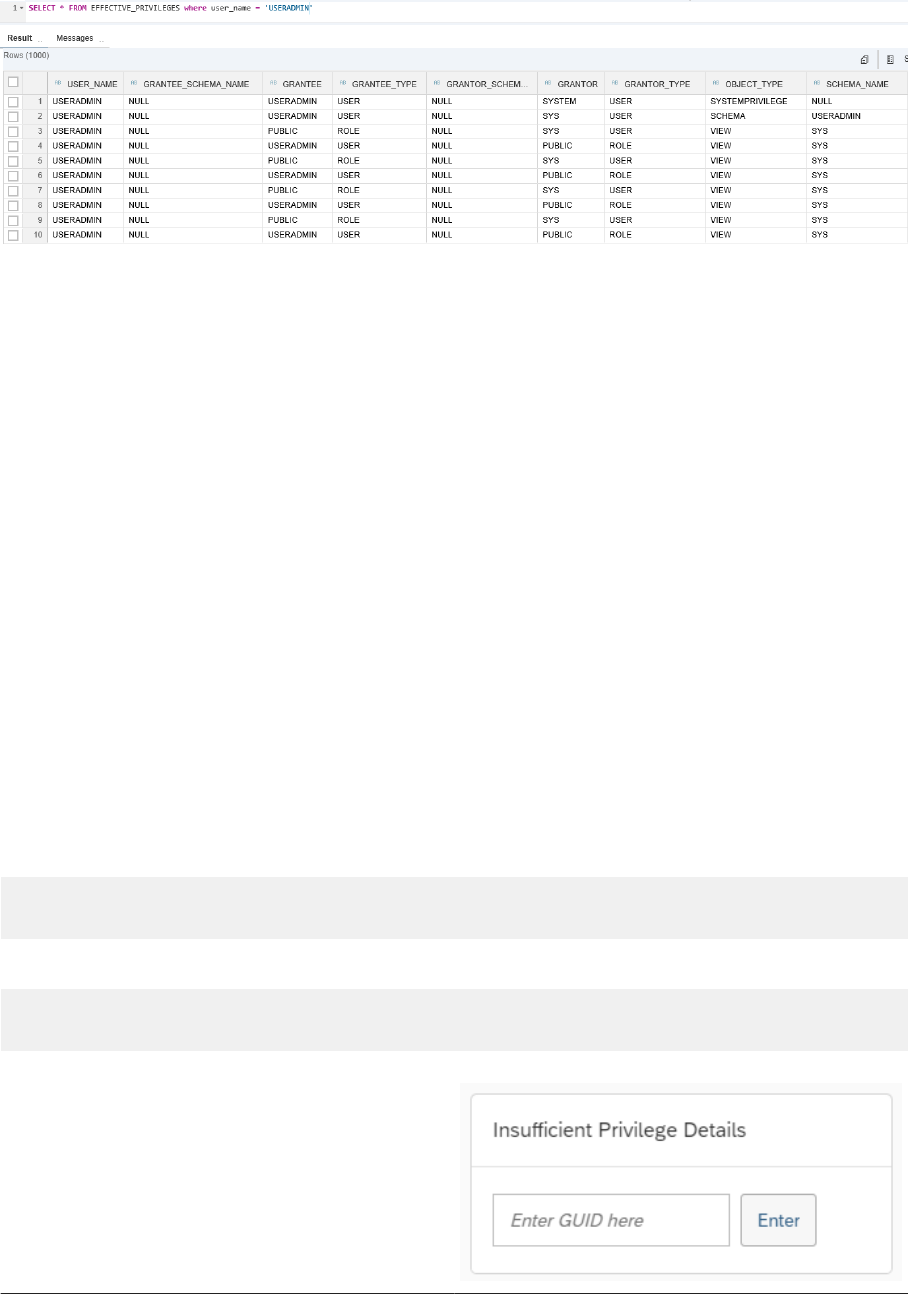
Output of Eective Privileges
Examples of querying this view can be found in the topics which follow:
• Troubleshoot the Display of Unrestricted or Incorrect Results for a View Secured with Analytic Privileges
• Troubleshoot the Error "Insucient privilege: Not authorized" Although User Has Analytic Privileges
• Troubleshoot the Error "Invalidated View" During SELECT Statement Execution
Full details of this view are given in the SAP HANA SQL Reference Guide.
For more information about other system views related to authorization, see System Views for Verifying Users'
Authorization in the Security Administration and User Management section of the SAP HANA Administration
Guide.
For more information about the authorization concept in SAP HANA, see the SAP HANA Security Guide.
Insucient Privilege Errors
To avoid the need to search through the indexserver trace les to analyze insucient privilege
errors, a procedure is available which you can use to quickly nd out details of missing privileges:
GET_INSUFFICIENT_PRIVILEGE_ERROR_DETAILS().
The insucient privilege error message includes a GUID value, for example:
insufficient privilege: Detailed info for this error can be found with guid
'3DFFF7D0CA291F4CA69B327067947BEE'
Use this value as a parameter for the stored procedure:
call SYS.GET_INSUFFICIENT_PRIVILEGE_ERROR_DETAILS
('3DFFF7D0CA291F4CA69B327067947BEE', ?)
In SAP HANA cockpit
a dialog box for this procedure is available
in the Security and User Management view:
SAP HANA Troubleshooting and Performance Analysis Guide
Root Causes and Solutions
PUBLIC 157
The procedure returns details of the missing privilege with the user name and the session user name. Object
details may also be returned if available, and if the missing privilege is contained in one or more roles then the
roles are displayed.
The procedure does not return information about analytical privileges.
For more information about this procedure, see 'Resolve Insucient Privilege Errors' in the SAP HANA
Administration Guide (Security Administration and User Management) and the corresponding topic in the SAP
HANA Cockpit Guide, 'Display Information about an Insucient Privilege Error'.
Authorization Dependency Viewer
SAP HANA Studio and SAP HANA cockpit include a graphical tool, the Authorization Dependency Viewer, to
analyze authorization issues. This may be helpful to troubleshoot authorization errors and invalid object errors
for stored procedures and calculation views with complex dependency structures. See the links under 'Related
Information'.
Related Information
System Views for Verifying Users' Authorization
EFFECTIVE_PRIVILEGES System View
SAP HANA Security Guide
Display Information about an "Insucient Privilege" Error
Resolve Insucient Privilege Errors
Resolve Errors Using the Authorization Dependency Viewer (SAP HANA Studio)
Resolve Object Authorization Errors (SAP HANA cockpit)
3.12.1.1Troubleshoot the Display of Unrestricted or Incorrect
Results for a View Secured with Analytic Privileges
If a user has unrestricted access to a view or sees results that he should not, even though he has been granted
an analytic privilege, you need to determine which privileges have been granted to the user and whether or not
they are correct.
Prerequisites
To troubleshoot this issue, you require the following system privileges:
• CATALOG READ
• TRACE ADMIN
158
PUBLIC
SAP HANA Troubleshooting and Performance Analysis Guide
Root Causes and Solutions

Procedure
• Check which analytic privileges have been granted to the user using the system view
EFFECTIVE_PRIVILEGES.
Execute the following SQL statement:
SELECT * FROM EFFECTIVE_PRIVILEGES WHERE USER_NAME = 'myuser' AND OBJECT_TYPE
= 'ANALYTICALPRIVILEGE';
In particular, verify that the user does not have the analytic privilege _SYS_BI_CP_ALL. This analytic
privilege potentially allows a user to access all the data in all activated views, regardless of any other
analytic privileges that apply. Usually, the user will have this analytic privilege through a role, for example,
MODELING.
Caution
The MODELING role is very privileged and should not be granted to users, particularly in production
systems. The MODELING role should only be used as a template.
• Identify wrong lters specied in the analytic privileges granted to the user.
Information about lter conditions generated from the relevant analytic privileges can be traced in the
indexserver trace le. This can help you to identify wrong lters specied in the analytic privileges granted
to the user.
In the Trace Conguration monitor of the SAP HANA database explorer, set the database trace level for the
component analyticprivilegehandler of the indexserver service to DEBUG.
Related Information
EFFECTIVE_PRIVILEGES System View
System Views for Verifying Users' Authorization
3.12.1.2Troubleshoot the Error "Insucient privilege: Not
authorized" Although User Has Analytic Privileges
Even if a user has the correct analytic privileges for a view, he still may receive the error Insufficient
privilege: Not authorized if there is an issue with privileges at another level.
Prerequisites
To troubleshoot this issue, you require the following system privileges:
• CATALOG READ
SAP HANA Troubleshooting and Performance Analysis Guide
Root Causes and Solutions
PUBLIC 159

• TRACE ADMIN
Procedure
• Verify that the _SYS_REPO user has all required privileges (for example, SELECT) with GRANT OPTION on
the base tables of the view.
You can do this by selecting from the EFFECTIVE_PRIVILEGES system view:
SELECT * FROM EFFECTIVE_PRIVILEGES WHERE USER_NAME = '_SYS_REPO';
• Verify that the analytic privileges required for any underlying views have been granted to the user.
If the view is a top-level view (calculation view) with underlying views, the granted analytic privilege grants
access only to this top-level view. Analytic privileges are required for all underlying views. Note that analytic
privileges have to contain at least a view attribute with or without lter condition in order to grant access to
the view.
You can verify a user's privileges by selecting from the EFFECTIVE_PRIVILEGES system view:
SELECT * FROM EFFECTIVE_PRIVILEGES WHERE USER_NAME = '<user>' AND OBJECT_TYPE
= 'ANALYTICALPRIVILEGE';
• If the analytic privilege uses a database procedure to dene dynamic value lters at runtime, check for
errors in the execution of the underlying procedure.
To nd out the actual error during procedure execution for analytical privileges, check the
indexserver_alert_<host>.trc trace le (accessible in the SAP HANA database explorer via the View
trace and diagnostic les link in the SAP HANA cockpit).
3.12.1.3Troubleshoot the Error "Invalidated View" During
SELECT Statement Execution
A user may receive the error Invalidated view when executing a SELECT statement against a view that was
activated from the repository. Additionally, the data preview for an activated view may not show any data.
Prerequisites
To troubleshoot this issue, you require the CATALOG READ system privilege.
Context
In addition to the privileges checks described here, other possible causes of invalidated views are described in
knowledge base articles. The cause may be related, for example, to the view not being active or the view may
160
PUBLIC
SAP HANA Troubleshooting and Performance Analysis Guide
Root Causes and Solutions

have been changed and is now unavailable. The KBAs listed below describe troubleshooting procedures in the
context of SAP HANA Studio, but the causes and solutions may still be relevant in any context.
Procedure
• Verify that the _SYS_REPO user has all required privileges (for example, SELECT, SELECT WITH GRANT
OPTION) on all base objects of the view (for example, tables) and schemas used.
You can do this by selecting from the EFFECTIVE_PRIVILEGES system view:
SELECT * FROM EFFECTIVE_PRIVILEGES WHERE USER_NAME = '_SYS_REPO';
• To grant this privilege you can execute the following statement:
GRANT SELECT ON SCHEMA <YOUR_SCHEMA> TO _SYS_REPO WITH GRANT OPTION;
This example shows GRANT SELECT ON SCHEMA, you can also grant the privilege on tables or views.
• Verify that the user activating the object has at least SELECT privilege over the schemas used within the
scenario.
To grant this privilege you can execute the following statement:
GRANT SELECT ON SCHEMA <YOUR_SCHEMA> TO
<USER_THAT_WILL_ACTIVATE_ANALYTIC_OBJECT>;
• Make sure all the dependencies of the analytic object to be activated are contained in the analytic privilege
assigned to the user that will actually activate the main analytic object.
Results
For more information on the GRANT Statement refer also to the details in the SAP HANA SQL Reference Guide
for SAP HANA Platform.
Related Information
GRANT Statement (Access Control)
Links to Knowledge Base Articles:
SAP Note 2318731 - Error "SAP DBTech JDBC: [391]: invalidated view: sap.hba.ecc" during data preview
SAP Note 3048185 - Error "SAP DBTech JDBC: [391]: invalidated view:" error occurs when add object
privilege
SAP Note 2985592 - Database returned the SQL code 391. Error text: invalidated view
SAP Note 1761917 - Error when executing an Analytic Object
SAP HANA Troubleshooting and Performance Analysis Guide
Root Causes and Solutions
PUBLIC 161

3.12.2Troubleshooting Problems with User Name/Password
Authentication
Common problems with regards to authentication are related to incorrect or expired passwords.
User administrators can change users' passwords on the Edit User monitor in the Cockpit Manager of the SAP
HANA cockpit.
For more information about managing users, see Security Administration and User Management and Reset the
SYSTEM User Password of a Tenant Database in the SAP HANA Administration Guide.
Related Information
Security Administration and User Management
Reset the SYSTEM User Password in a Tenant Database (SAP HANA Cockpit)
3.12.2.1Resetting the Password for the SYSTEM User
If the password of the SYSTEM user is irretrievably lost, it can be reset.
Follow the procedure as described in the SAP HANA Administration Guide.
Note
If you can log on as SYSTEM and you want to change the password, do not use the emergency reset
procedure. Simply change the password directly using the SAP HANA cockpit or the ALTER USER SQL
statement: ALTER USER SYSTEM PASSWORD new_password.
Related Information
Resetting the SYSTEM User Password (SAP HANA Cockpit)
162
PUBLIC
SAP HANA Troubleshooting and Performance Analysis Guide
Root Causes and Solutions

3.12.2.2Troubleshoot the Error "User is locked"
A user receives the error User is locked after too many failed log on attempts.
Prerequisites
You have system privilege USER ADMIN.
Context
An example of this error might look like:
Error "user is locked; try again later: lock time is 1440 minutes; user is locked
until 2014-05-28 21:42:24.12214212" (the time is given in UTC).
Most likely, the user logged on too many times with the wrong password. The default maximum
number of failed logon attempts is 6. This is dened by the password policy parameter
maximum_invalid_connect_attempts.
For more information about this and other password policy parameters, see Password Policy Conguration
Options in the SAP HANA Security Guide.
Procedure
Reset the invalid connect attempts with the following SQL statement:
ALTER USER <user> RESET CONNECT ATTEMPTS;
The user can now log on again.
Related Information
Password Policy Conguration Options
SAP HANA Troubleshooting and Performance Analysis Guide
Root Causes and Solutions
PUBLIC 163

3.12.3Troubleshooting Problems with User Authentication
and SSO
Authentication problems manifest themselves as failed user logon. In many cases, the reason for the failure will
not be clear to the user. You need to analyze the database trace to determine the cause of the problem.
For security reasons, no information about error conditions are provided to a user directly after a failed logon
attempt, since this could be abused by attackers. In case of authentication problems, the aected user must
contact the system administrator, who will then analyze the database trace on the server side.
Tracing for SSO Issues
Logon information is available in the database trace, but by default, it does not log much. The rst step
in troubleshooting any SSO logon issue therefore is to increase the trace level of the authentication-related
components of the database trace. You can do this in the SAP HANA cockpit / Database Explorer or in SAP
HANA Studio on the Database Trace section of the Trace Conguration tab.
For problems with JDBC/ODBC-based logon, increase the trace level of the authentication for the index
sever to DEBUG.
For problems with HTTP-based logon via SAP HANA XS classic, increase the trace level of the
authentication, xssession, and xsauthentication components for the xsengine server to DEBUG.
Once you have increased tracing, reproduce the problematic logon. The traces will now contain more
descriptive error messages.
Remember
After completing troubleshooting, reduce the authentication trace level back to the default.
In some cases, especially for Kerberos and SPNEGO, it is necessary to use other sources of tracing, such as:
• JDBC, ODBC or SQLDB trace
• Windows event log
• Debugger of browser
• SAP Web dispatcher trace
• Network packet snier, for example, Wireshark
For more information about tracing in SAP HANA see the section on traces in the SAP HANA Administration
Guide and SAP Note 2119087.
Tip
Guided Answers is a support tool for troubleshooting problems using decision trees. A guided answer is
available for tracing SSO issues.
Related Information
Traces
Single Sign-On Integration
164
PUBLIC
SAP HANA Troubleshooting and Performance Analysis Guide
Root Causes and Solutions

Kerberos-Related Authentication Issues [page 165]
SAML Authentication [page 166]
Traces for SSO Troubleshooting (Guided Answer)
SAP Note 2119087
3.12.3.1Kerberos-Related Authentication Issues
GSS API Errors
Kerberos authentication is implemented in the SAP HANA database using the Generic Security Services
Application Program Interface (GSS API). Since GSS API is an internet standard (RFC 4121), all Kerberos-
related errors are traced under the authentication trace component in the following generic way:
<SAP HANA DB error text> (<GSS major code>.<GSS minor code> - <GSS major text> <GSS
minor text>)
GSS API error texts are sometimes dicult to relate to the concrete problem. The following table contains
some hints for selected trace messages, refer also to the How-to document attached to SAP Note 1837331 for
full details of these and other problems.
GSS API Error
Code Error Text Hint Solution
851968.252963
9142
Minor error text: Key version
number for principal
in key table is
incorrect
The service key table (keytab) in
use on the SAP HANA database
host does not match the one cre-
ated on the authentication server.
Re-export the keytab le from the
authentication server and re-im-
port it into the host’s Kerberos in-
stallation.
851968.397560
33
SAP HANA database error
text: Cannot get keytab
entry for host: <FQDN>
Minor error text: No
principal in keytab
matches desired name
The location of the Kerberos
keytab le might be incor-
rect. The le is located
in directory $HOME/etc (by
default, that is /usr/sap/
<SID>/home/etc/
krb5_hdb.keytab).
Check environment variable
KRB5_KTNAME.
851968.252963
9136
SAP HANA database error
text: Cannot get keytab
entry for host: <FQDN>
Minor error text:
Configuration file
does not specify
default realm
The location of the Kerberos
conguration le might be in-
correct. The le is located
in directory $HOME/etc (by
default, that is /usr/sap/
<SID>/home/etc/
krb5_hdb.conf).
Check environment variable
KRB5_CONFIG.
Conguration
There are many potential problems setting up a Kerberos infrastructure that are not related to the SAP HANA
system in particular, but relevant for any Kerberos-based authentication. For further information, refer to the
documentation provided with MIT Kerberos or Microsoft Server/Active Directory.
SAP HANA Troubleshooting and Performance Analysis Guide
Root Causes and Solutions
PUBLIC 165
Useful SAP Notes
SAP Note Description
1837331
HOWTO HANA DB SSO Kerberos/ Active Directory
2354473
SSO troubleshooting for HANA and Analysis Oce (SPNEGO)
1813724
HANA SSO/Kerberos: create keytab and validate conf
2354556
Common errors when executing hdbkrbconf.py
Related Information
Single Sign-On Using Kerberos
3.12.3.2SAML Authentication
User cannot connect with SAML assertion
If a user cannot connect to SAP HANA with a SAML assertion, the issuer and subject distinguished
names (DNs) in the SAML assertion do not match those congured in the identity provider. Investigate
which issuer and subject DNs were used in the SAML assertion. You will nd them in the trace le
indexserver_alert_<hostname>.trc. Compare these with those congured in the service provider.
Useful SAP Notes
SAP Note
Description
1766704
How to use Fiddler to collect HTTP and HTTPS traces
2284620
HOW-TO HANA DB SSO SAML and BI Platform 4.1 / AO 2.2
Tip
Guided Answers is a support tool for troubleshooting problems using decision trees. A guided answer is
available for SAML authentication with SAP HANA.
Related Information
Single Sign-On Using SAML 2.0
SAML Authentication for Single Sign-On (Guided Answer)
166
PUBLIC
SAP HANA Troubleshooting and Performance Analysis Guide
Root Causes and Solutions

3.13 Transactional Problems
This section covers troubleshooting of transaction problems. Symptoms seen from an end user perspective
may include an application running sluggishly, or not responding or even seeming to hang. These problems
may be caused by issues with uncommitted transactions, long-lived cursors blocking garbage collection, a high
number of active versions or blocked transactions.
Maximum Transaction Limit
The default system limit for the maximum number of transactions is 64000. If this limit is exceeded, an error
message may be returned when submitting queries: "exceed maximum number of transactions". This may be
caused by application programs which are not correctly managing connections/transactions, or a bug within
the database engine. This scenario and possible workarounds are described in detail in SAP Note 2368981 -
SAP HANA DB: Queries fail with error "exceed maximum number of transaction".
Related Information
SAP Note 2368981
3.13.1Blocked Transactions
Blocked transactions are write transactions that are unable to be further processed because they need to
acquire transactional locks (record or table locks) which are currently held by another write transaction.
This section focuses on blocking caused by transaction locks though transactions can also be blocked waiting
for physical resources like network or disk. A basic general analysis step is to determine if few transactions are
blocked or many and this section deals with these two aspects separately.
Administration tools for analyzing the cause of blocked transactions are available in SAP HANA Cockpit and
SAP HANA Studio. The analysis steps you take depend rstly on whether the blocking is current or whether
it happened in the past. Monitoring views (named M_*) provide information about the current state of the
database and the corresponding set of HOST_ views include data from persisted history information, for
example:
M_BLOCKED_TRANSACTIONS (current data)
HOST_BLOCKED_TRANSACTIONS (historical data)
The SAP Note 1858357 - HANA DB: Analysis of Wait Situations describes two locking scenarios covering both
current and historical lock situations.
The SQL Statement Collection for SAP HANA available with SAP Note 1969700 includes scripts which can be
executed to provide a basic analysis. The following scripts can be customized to search current or historical
data:
• HANA_Locks_Transactional_LockWaits*
• HANA_Locks_Transactional_LockWaits_Hierarchy* - shows the relationship between dependent
transactions
SAP HANA Troubleshooting and Performance Analysis Guide
Root Causes and Solutions
PUBLIC 167
The output of these scripts includes essential information about the type of lock, its duration, transaction ID
and information about the lock holder. See also the script HANA_Locks_Transactional_LockWaits_PerObject.
For more information on lock analysis refer to the SAP Note 1999998 - FAQ: SAP HANA Lock Analysis
Lock Timeout
Transactional lock waits automatically terminate after a predetermined time period - by default this is 30
minutes (1800000 ms). The timeout period is dened in the following parameter: lock_wait_timeout in
the [transaction] section of the inexserver.ini le. If a blocked transaction times out it is rolled back with error:
SQL error 131: transaction rolled back by lock wait timeout. The value of this parameter is
monitored and alert 16 is generated if the value is outside the range of 100,000ms to 7,200,000ms.
Related Information
Identify and Assess Blocked Transaction Issues [page 171]
Single or Few Transactions are Blocked [page 173]
Many Transactions are Blocked [page 174]
Troubleshooting Blocked Transaction Issues that Occurred in the Past [page 175]
SAP Note 1969700
SAP Note 1999998
SAP Note 1858357
3.13.1.1Using Scripts to Analyze Blocked Transactions
You can use scripts to analyze the issues underlying blocked transactions. Modify the time range analyzed by
the script, then use it to identify the lock owner, get information on the lock wait hierarchy, or analyze thread
activity on the database at the time of the block.
Identify the Lock Owner: Transactional Lock Waits Hierarchy Script
The HANA_Locks_Transactional_LockWaits_Hierarchy_* script can help you to gather information on current
and historic lock wait situations, including the lock owner and the lock wait hierarchy. The asterisk (*) in the
script title is a placeholder for the SAP HANA release and revision.
Modify a Script
Where relevant, the SQL support scripts contain sections which can be customized to enter your own
parameter values, these are marked with the comment '/* Modification section */'. For example:
( SELECT /* Modification section */
'%' HOST,
'%' PORT,
'%' OBJECT_TYPE, ...
)
168
PUBLIC
SAP HANA Troubleshooting and Performance Analysis Guide
Root Causes and Solutions
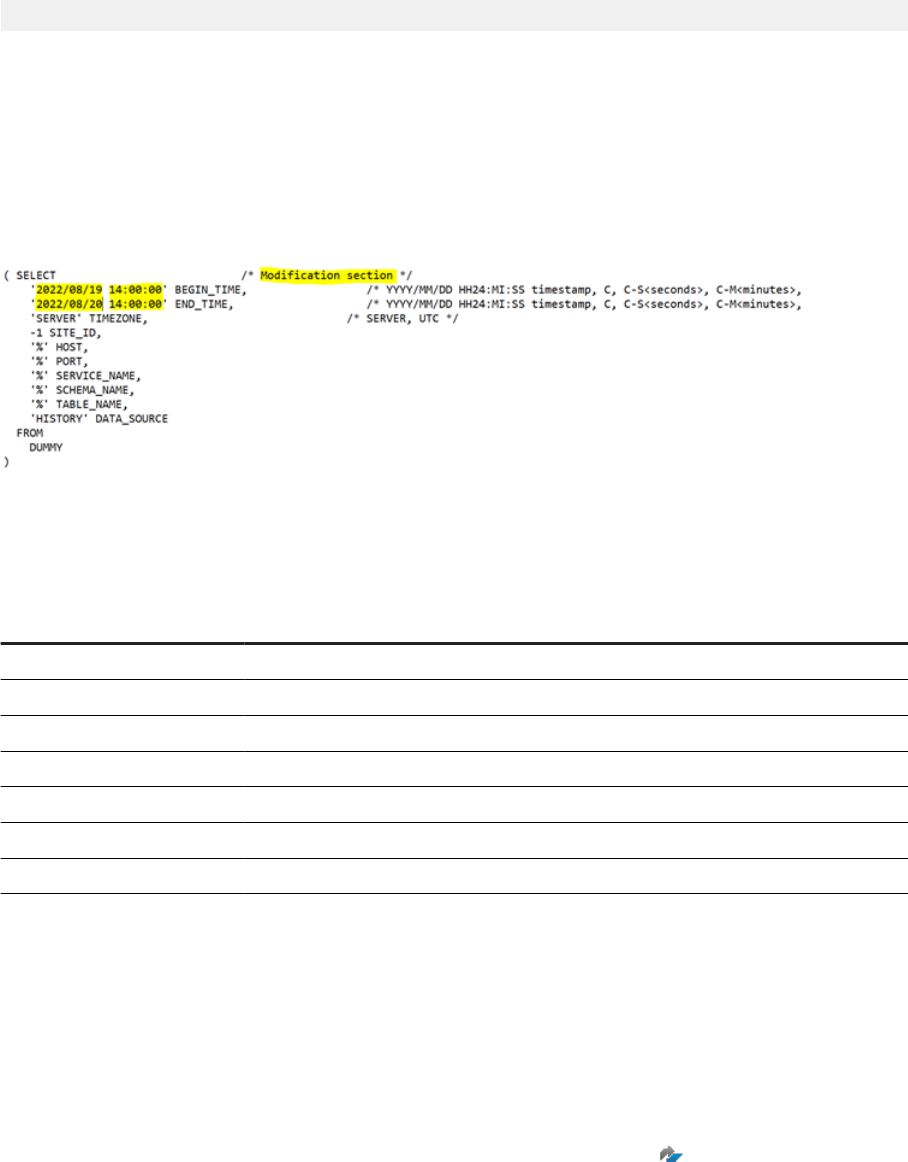
If you want to analyze a specic time range, you can modify the time parameters using the codes described in
the comment block of the script, in the section INPUT_PARAMETERS . You can use 'C-H12' BEGIN_TIME, or
you can enter a specic date and time.
To do this, in place of 'C-H12' BEGIN_TIME and 'C' END_TIME, enter the date and time you want to
analyze, in the format 'YYY/MM/DD HH24:MI:SS'.
Example: To check for transaction lock waits that happened between 19/08/2022 at 2pm and 20/08/2022 at
2pm, the modication part of the script would look like this:
You can then execute the script and check for transaction lock waits in your system for the relevant date and
time.
The output parameters are explained in the comment block of the script. Key columns include:
Output Columns
Explanation
WAIT_S Seconds since the lock wait started
LT Lock type ('R'=RECORD, 'T'=TABLE, 'M'=METADATA)
LM Lock mode ('E'=EXCLUSIVE, 'IE'=INTENTIONAL EXCLUSIVE, 'S'=SHARED)
A Lock holder ('X'=lock holder on SAP HANA side, ' '= lock holder outside SAP HANA)
OBJECT_NAME Object name related to the lock wait
STATEMENT_HASH Statement hash related to the lock wait
CONN_ID Connection ID (Indent indicates hierarchy)
As a starting point for your analysis, refer to the value for the Column 'A' to identify the lock owner. The steps
you take to troubleshoot the block depend on whether the issue is within the SAP HANA Database or caused by
factors external to the database.
If the issue is outside of the SAP HANA Database
If the value for Column 'A' in the script output is blank (' '), the lock owner is outside the SAP HANA Database.
Consider checking the application and the network.
• Check the application: The application associated with the lock is named in the column 'APPLICATION
SOURCE'. You can search for known application lock issues in KBA 2000002
, FAQ: SAP HANA SQL
Optimization, in particular Question 13, "Are there standard recommendations for specic SQL statements
available?" Search the section using the application name, the OBJECT_NAME (this is usually a table
name), and the STATEMENT_HASH related to the lock.
SAP HANA Troubleshooting and Performance Analysis Guide
Root Causes and Solutions
PUBLIC 169

• If you don't nd any issues on the application side, the next step would be to check the network between
the application client and the SAP HANA Database. See KBA 2081065 , Troubleshooting SAP HANA
Network, especially Section 1, "Analyze Round Trip Time (RTT) Between Server and Client".
You can also use SAP's NIPING program to analyze the network connection between any two machines
running SAP software: see SAP Note 500235 , Network Diagnosis with NIPING.
If the lock owner is active on the SAP HANA Database side
If the value in Column 'A' in the script output is 'X', the lock owner is active on the SAP HANA Database side
and further analysis is required on the database side. You can check the HANA thread samples to see what the
HANA threads are doing at the time of the block.
Analyze Thread Activity: Threads Filter and Aggregation Script
You can use the script HANA_Threads_ThreadSamples_FilterAndAggregation_* to see what the HANA threads
are doing on the database during a block.
First you need to modify the time range of your analysis, as described above.
Next you can dene the level of detail you want in the script output. Use the parameter AGGREGATE_BY
in the 'Modication section' of the script. For example, the 'AGGREGATE_BY' value 'THREAD_METHOD,
THREAD_DETAIL' species that the script will be aggregated by thread method and thread detail. If you want
to see more detailed information in the script output you can remove this aggregation detail by replacing
'THREAD_METHOD, THREAD_DETAIL' with 'NONE'.
In the script output, you get important information from the values in the columns 'THREAD_STATE' and
'LOCK_NAME' for the time that you have the lock wait issue.
Further Information
• The collection of support scripts is provided as an attachment to 1969700, SQL Statement Collection for
SAP HANA.
See the "Solution" section for further information on how support scripts can be modied
and for known issues.
• See also KBA 1999998 , FAQ:SAP HANA Lock Analysis, in particular Question 5, "How can transactional
lock waits be analyzed and optimized?"
• For more information on HANA thread samples, and to assess whether thread samples are involved in
the lock situation, follow the steps outlined in see KBA 2114710 , FAQ: SAP HANA Threads and Thread
Samples.
• If you notice a high number of transactional (record and object) lock waits at the same time as many
semaphore and mutex waits, then it's likely that the semaphore and mutex waits are causing the
transactional locks. See KBA 1999998 , FAQ:SAP HANA Lock Analysis, in particular Question 6, "How
can internal lock waits be analyzed?"
• For known application lock contention issues, see KBA 2000002
, FAQ: SAP HANA SQL Optimization,
especially Question 13, "Are there standard recommendations for specic SQL statements available?"
170
PUBLIC
SAP HANA Troubleshooting and Performance Analysis Guide
Root Causes and Solutions
3.13.1.2Identify and Assess Blocked Transaction Issues
The rst signs of blocked transactions may be poor application response or alerts 49 or 59 are raised.
The initial indicators of blocked transactions are often given by:
• Users reporting bad application responsiveness
• Alert 49 - Long-running blocking situations
• Alert 59 - Percentage of transactions blocked
To conrm that poor database performance is caused by blocked transactions, you should check the following
performance monitoring tools in SAP HANA cockpit:
Performance Monitor
On the Performance Monitor you can enable the KPI Blocked Transactions to plot the occurrence of any
blocked transactions in the current time frame.
Workload Analysis Monitor
Also on the Performance Monitor, look at the Background Jobs tab which shows currently running SAP HANA
background processes like Delta Merge. Since the Delta Merge needs to lock tables to proceed, it is a common
cause for blocked transactions. Another background job displayed by this monitor is the savepoint write job
which requires a global database lock in its critical phase. The Savepoint Performance topic gives more details
about analyzing and troubleshooting the locking phases of this job.
The following views may help to analyze delta merge:
• SYS.M_DELTA_MERGE_STATISTICS
• _SYS_STATISTICS.HOST_DELTA_MERGE_STATISTICS - for historical information.
The following views may help to analyze and check if a savepoint was written during the time of the blockage:
• SYS.SAVEPOINTS
• _SYS_STATISTICS.HOST_SAVEPOINTS - for historical information.
Sessions Monitor
The Sessions tile and monitoring tool lists all currently opened SQL sessions (meaning user connections). In
the context of blocked transaction troubleshooting, the columns Blocked By Connection ID and Blocks No. Of
Transactions are of special interest. The rst tells you whether the session is blocked by another session and
identies the ID of the blocking one. The latter gives you the corresponding information if a session blocks
other sessions, and how many transactions are aected.
SAP HANA Troubleshooting and Performance Analysis Guide
Root Causes and Solutions
PUBLIC 171
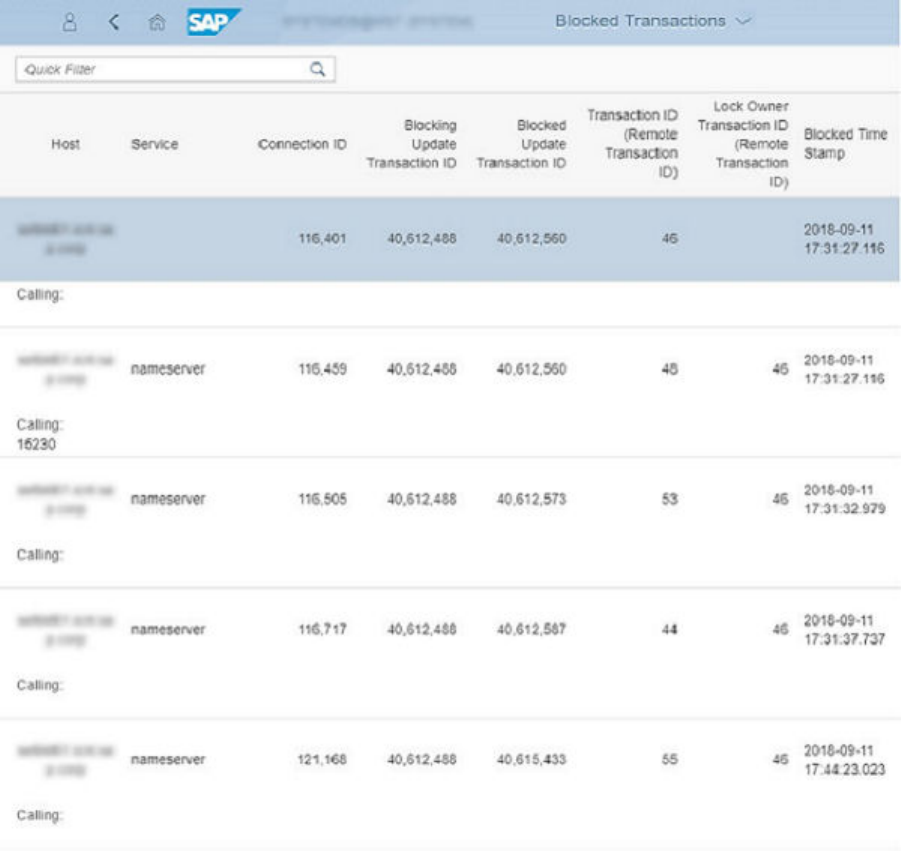
Blocked Transactions Monitor
The Open blocked transactions link on the Monitoring tile is the next drill down step. The display only lists
those transactions that are currently blocked. The ordering is done via a blocking/blocked relation. That means
transactions that are blockers are highlighted. Directly beneath the blocked transactions are displayed. In the
following illustration you can see transaction 46 blocking multiple other transactions:
Blocked Transactions Monitor
See also Blocked Transactions in the SAP HANA cockpit documentation.
172
PUBLIC
SAP HANA Troubleshooting and Performance Analysis Guide
Root Causes and Solutions

Threads Monitor
The Threads monitor (available from the Threads tile) gives the most ne-grained view of the current situation
by listing all threads currently active in the system, although it is usually not necessary to drill into that level of
detail. See also the Threads topic in the SAP HANA cockpit documentation.
Related Information
Savepoint Performance [page 118]
Links to SAP HANA Cockpit Guide:
The Performance Monitor
Blocked Transactions
Session Monitoring
Threads
SAP Note 2079396
SAP Note 2081856
3.13.1.3Single or Few Transactions are Blocked
If you identied only a single or a few blocking transactions, there is likely an issue on application side.
Check the Application
A usual pattern is a aw in the application coding that does not commit a write transaction. Such a transaction
will be a blocker for any other transaction that needs to access the same database object. To release the
situation you have to close the blocking transaction.
There are several possibilities to achieve this:
• Contact the Application User
You can identify the user of the application via the Sessions tile. This information is visible in the “Database
User” column or, in case the application has its own user management (for example, SAP BW), in the
“Application User” column. Contact the user and ask them to close the application.
• Contact the Application Developer
As a follow-up, the author of the application should be contacted to discuss how such situations can be
avoided in the future by changing the application code.
Cancel the Session
If you are not able to contact the user to cancel the session, you can also cancel the session from the list of
sessions accessed via the Sessions tile. The session cancellation may take some time to complete, but after
canceling the session the current transaction will be rolled back.
SAP HANA Troubleshooting and Performance Analysis Guide
Root Causes and Solutions
PUBLIC 173
Kill the Client Application
In case the session cancellation takes too long or does not complete at all, you can kill the client process that
opened the session. This will terminate the blocking transaction as well. Note that killing the client application
is safe from a database consistency standpoint, the current transaction will be rolled back gracefully.
To do this you have to have access to the client machine. The information needed for this task can be retrieved
from the Sessions tile. See columns <Client IP> and <Client Process ID> to determine the host and
process to be killed.
3.13.1.4Many Transactions are Blocked
In the case that a large number of transactions are blocked, the troubleshooting should take a slightly dierent
approach.
First you need to determine whether there is a single or few blocking transactions that block a large amount
of other transactions. For this, open the Blocked Transactions monitor and check the amount of blocking
transactions. If you determine that there are only a few blocking transactions, use the techniques described in
Single or Few Transactions are Blocked to resolve the situation.
If there are many transactions in a blocking state, you need to nd out whether a specic access pattern
causes the situation. In cases where multiple transactions try to write to the same database objects they block
each other. To check if this situation exists, open the Blocked Transactions monitor and analyze the “Waiting
Schema Name”, “Waiting Object Name” and “Waiting Record Id” columns. If you nd a fair amount of blocking
transactions that block many other transactions you need to investigate if the following is possible:
• Change the client applications to avoid the access pattern
• If a background job is running that issues many write transactions (for example, a data load job) then
reschedule the job to a period with a low user load
• Partition tables that are accessed frequently to avoid clashes. See the SAP HANA Administration Guide for
more details on partitioning.
In case you cannot identify specic transactions or specic database objects that lead to transactions being
blocked, you have to assume a problem with the database itself or its conguration. One example is an issue
with long savepoint durations - see Savepoint Performance for troubleshooting such issues.
Related Information
Single or Few Transactions are Blocked [page 173]
Savepoint Performance [page 118]
Table Partitioning
174
PUBLIC
SAP HANA Troubleshooting and Performance Analysis Guide
Root Causes and Solutions
3.13.1.5Troubleshooting Blocked Transaction Issues that
Occurred in the Past
Finding the root cause of blocked transaction situations that occurred in the past and which you have resolved
is more dicult than troubleshooting issues that are currently happening. Tools such as the Performance
Monitor, system views and the SQL Plan Cache are available to help you.
Using SAP HANA cockpit you can rstly use the Performance Monitor to set the time frame covering the period
where the issue happened. Using the information returned, investigate what happened at this specic point in
time.
You should check the monitoring and Statistics Server view
_SYS_STATISTICS.HOST_BLOCKED_TRANSACTIONS. Analyze the columns “WAITING_SCHEMA_NAME”,
“WAITING_TABLE_NAME” and “WAITING_RECORD_ID” to identify the database objects that lead to blocked
transactions.
In addition, the SAP HANA cockpit SQL Plan Cache monitor (available on a tab page from the SQL Statements
tile) may be able to provide information about the statements that were involved in the situation. You may
need to change the selection of visible columns to see the relevant information and then use the sort
feature to search for and identify the relevant entries. For entries that have “TOTAL_LOCK_WAIT_COUNT”
> 0 compare the column “MAX_CURSOR_DURATION” against “AVG_CURSOR_DURATION”. An entry where
there is a signicant dierence (where the transaction took much longer than average) may indicate that it was
involved in the situation.
The SQL Statement Collection for SAP HANA available with SAP Note 1969700 includes scripts which can be
customized to search historical data (see the topic Blocked Transactions).
Related Information
The Performance Monitor
Monitor and Analyze Statements with SQL Plan Cache
Blocked Transactions [page 167]
3.13.2Multiversion Concurrency Control (MVCC) Issues
In this section you will learn how to troubleshoot issues arising from MVCC.
Multiversion Concurrency Control (MVCC) is a concept that ensures transactional data consistency by
isolating transactions that are accessing the same data at the same time.
To do so, multiple versions of a record are kept in parallel. Issues with MVCC are usually caused by a high
number of active versions. Old versions of data records are no longer needed if they are no longer part of a
snapshot that can be seen by any running transaction. These versions are obsolete and need to be removed
from time to time to free up memory.
This process is called Garbage Collection (GC) or Version Consolidation. It can happen that a transaction is
blocking the garbage collection. The consequence is a high number of active versions and that can lead to
system slowdown or out-of-memory issues.
SAP HANA Troubleshooting and Performance Analysis Guide
Root Causes and Solutions
PUBLIC 175
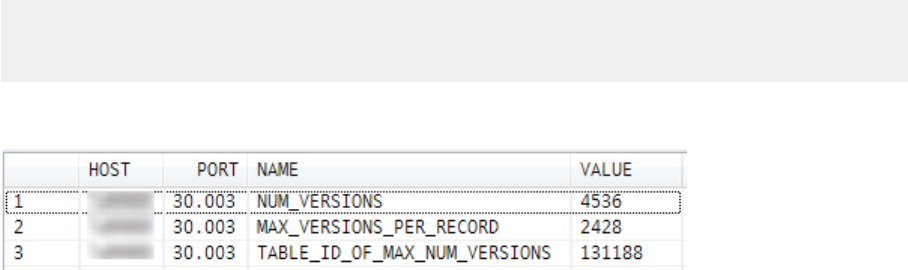
3.13.2.1Row Store Tables
Garbage collection is triggered after a transaction is committed and also periodically (every hour by default).
A transaction that is currently committing can be identied in the Threads tile (see System Performance
Analysis). The Thread Type will be “SqlExecutor” and the Thread Method “commit”.
The periodic garbage collection can be identied by Thread Type ”MVCCGarbageCollector”.
Note that the periodic garbage collection interval can be congured in the indexserver.ini le transaction
section with the parameter gc_interval.
Related Information
System Performance Analysis [page 237]
3.13.2.2MVCC Problem Identication
You can check for a number of indicators of MVCC problems.
Problems with a high number of active versions can be identied by:
• users reporting an increase of response times
• the indexserver trace containing "There are too many un-collected versions. The transaction blocks the
garbage collection of HANA database."
• checking Active Versions in the Performance Monitor
Transactions blocking garbage collection can originate from:
• Long-running or unclosed cursors
• Long-running transactions with isolation mode “serializable” or ”repeatable read”
• Hanging threads
In order to validate that there is a problem with MVCC, check the number of active versions in the row-store
MVCC manager monitoring view (M_MVCC_TABLES). Note that in a multihost environment, you have to check
the master host.
select * from m_mvcc_tables where host='MyHost' and port='30003' and
(name='NUM_VERSIONS' or name='MAX_VERSIONS_PER_RECORD' or
name='TABLE_ID_OF_MAX_NUM_VERSIONS');
MVCC Information on a Healthy System
176
PUBLIC
SAP HANA Troubleshooting and Performance Analysis Guide
Root Causes and Solutions
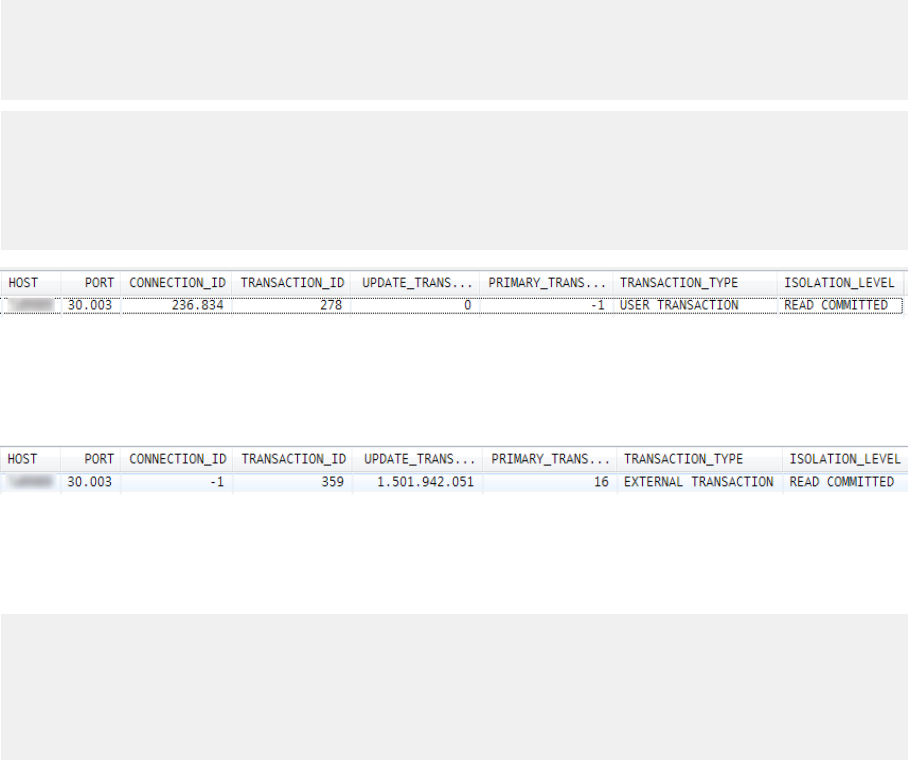
If the number of active versions (NUM_VERSIONS) is greater than eight million, it is considered a problem
and an overall slowdown of the system can be experienced. Similarly, if the maximum number of versions
per record (MAX_VERSIONS_PER_RECORD) exceeds 8,000,000, this should be treated as a problem and a
slowdown of accesses to a specic table is expected. Use TABLE_ID_OF_MAX_NUM_VERSIONS and join it
against the SYS.TABLES system view to determine the table which is having the problem.
Related Information
Performance Trace [page 288]
3.13.2.3Analysis of MVCC Issues
You have to nd out which transactions are blocking the garbage collection and to which connection they are
related.
The following queries will return the transaction that may block the garbage collection. You have to check both.
SELECT top 1 host, port, connection_id, transaction_id, update_transaction_id,
primary_transaction_id, transaction_type, isolation_level FROM M_TRANSACTIONS
WHERE
MIN_MVCC_SNAPSHOT_TIMESTAMP > 0 order by min_mvcc_snapshot_timestamp ASC;
SELECT top 1 host, port, connection_id, transaction_id, update_transaction_id,
primary_transaction_id, transaction_type, isolation_level FROM M_TRANSACTIONS
WHERE
MIN_MVCC_SNAPSHOT_TIMESTAMP = (SELECT MIN(VALUE) FROM M_MVCC_TABLES WHERE NAME
=
'MIN_SNAPSHOT_TS') order by min_mvcc_snapshot_timestamp ASC;
User Transaction Possibly Blocking Garbage Collection
In case of a user transaction being the candidate (TRANSACTION_TYPE=’USER TRANSACTION’), you can
directly determine the connection ID the transaction belongs to (see an example in the gure above).
External Transaction Possibly Blocking Garbage Collection
If the candidate’s transaction type is ‘EXTERNAL TRANSACTION’, use the following query to nd out which
other transaction spawned the candidate and determine its connection ID.
SELECT t.connection_id AS "Kill this connection id",
t.transaction_id AS "Belonging to user transaction id",
e.transaction_id AS "To get rid of external transaction id"
FROM m_transactions t
JOIN m_transactions e ON
e.primary_transaction_id = t.transaction_id
AND e.volume_id = t.volume_id
SAP HANA Troubleshooting and Performance Analysis Guide
Root Causes and Solutions
PUBLIC 177

WHERE e.transaction_type = 'EXTERNAL TRANSACTION' and e.transaction_id = <GC
blocker transaction id>;
3.13.2.4Solution of MVCC Issues
Solving MVCC issues is similar to solving blocked transaction issues. Use the following approaches in the given
order for transactions where you know the connection ID.
1. Contact the user to stop his activity.
2. Cancel the statement/cancel the internal transaction.
3. Cancel the connection.
4. Kill the client application.
Note
There is no guarantee that these measures will stop a transaction which blocks the garbage collection. If
necessary contact development support to get further help.
Related Information
Resolving CPU Related Issues [page 84]
3.13.3Version Garbage Collection Issues
Alert 75 helps you to identify and resolve version space overow issues.
Context
The following steps allow you to check whether or not the issue you have is related to row store version space
skew, that is, whether the row store version chain is too long. If you use extended storage, a version space
overow may manifest as an out-of-space error for the delta dbspace, and will not trigger this alert. See Out of
Space Errors for Delta Dbspace in SAP HANA Dynamic Tiering: Administration Guide.
Procedure
1. The rst step is to check the alert.
2. Identify the statement and connection blocking garbage collection.
178
PUBLIC
SAP HANA Troubleshooting and Performance Analysis Guide
Root Causes and Solutions
In the SAP HANA database explorer you can use the following set of predened statements to display
details of blocking connections; these are available in the Statement Library:
• MVCC Blocker Connection shows connections that may be blocking garbage collection.
• MVCC Blocker Statement shows statements that may be blocking garbage collection.
• MVCC Blocker Transaction shows transactions that may be blocking garbage collection.
a. Identify the connection or transaction that is blocking version garbage collection.
Run MVCC Blocker Statement to nd out which statement is blocking version garbage collection and
investigate what the blocker is doing. The following table shows a selection of example values which
may be returned by this query followed by some guidance about analyzing the results:
Example Values from MVCC Blocker Statement
Type
IDLE_TIME_SE
C CONNECTION_ID
START_MVCC_TI
MESTAMP
STATE-
MENT_STRING INFO
GLOBAL 4000 200285 142113 SELECT * FROM
TEST1
Check VER-
SION_COUNT in
M_MVCC_OVERVIEW
TABLE 5000 200375 142024 SELECT * FROM
TEST2 ORDER BY
A
Check VER-
SION_COUNT
in M_MVCC_TA-
BLE_SNAPSHOTS
TABLE
100 200478 142029 SELECT * FROM
TEST0 ORDER BY
A
Check VER-
SION_COUNT
in M_MVCC_TA-
BLE_SNAPSHOTS
If the TYPE column is GLOBAL, then it is a global version garbage collection blocker. If there is a global
garbage collection blocker whose idle time (IDLE_TIME_SEC) is greater than 3600 seconds (1 hour),
investigate what the statement is doing and take the necessary corrective action. See row 1 in the
above table.
If the TYPE is TABLE, then it is a blocker of the specic table. This is shown in the second row of the
table above where a table level garbage collection blocker has an idle time greater than 3600 seconds
(1 hour). In this case you can query the M_TABLE_SNAPSHOTS monitoring view to check how many
versions the related table has (in this example TEST2):
SELECT * FROM M_TABLE_SNAPSHOTS WHERE TABLE_NAME = 'TEST2' AND
START_MVCC_TIMESTAMP = 142024
If the result of the query shows that VERSION_COUNT is greater than 1 million, the blocking statement
can cause a performance drop for table updates. In this case, investigate what the statement is doing
and take the necessary corrective action. However, if VERSION_COUNT is less than 10,000, its impact
on performance is negligible.
b. If no blocker is shown by MVCC Blocker Statement, use MVCC Blocker Transaction to nd out which
transaction blocks global version garbage collection and investigate what the blocker is doing. The
SAP HANA Troubleshooting and Performance Analysis Guide
Root Causes and Solutions
PUBLIC 179
blocker would most likely be an internal/external/serializable transaction; the lifetime value of the
transaction is shown in the column LIFE_TIME_SEC.
3. Kill the transaction and/or disconnect the connection that is blocking garbage collection.
a. Disconnect the connection.
To disconnect the blocking connection use: ALTER SYSTEM DISCONNECT SESSION
'CONNECTION_ID'.
b. If disconnecting the connection does not succeed or CONNECTION_ID does not exist, kill the
transaction.
In order to do that, look at Blocked Transactions in the Monitoring tile.
Related Information
SAP HANA Dynamic Tiering
3.14 Statement Performance Analysis
This section gives an overview of issues and solutions concerning SQL statement performance.
For more information about optimizing and ne-tuning queries refer to the SAP HANA Performance Guide for
Developers which includes sections such as:
Ongoing Development of SQL Query Processing Engines
Starting from HANA 2 SPS 02, two new processing engines to execute SQL queries are being phased in to SAP
HANA:
• Extended SQL Executor (ESX)
• HANA Execution Engine (HEX)
The functionality of the product remains the same but these engines oer better performance.
In the SPS 02 release these engines are active by default (no conguration is required) and are considered
by the SQL optimizer during query plan generation. In the SPS 02 release, the focus of the HEX engine is on
queries that are typical in OLTP scenarios. Queries that are not supported by HEX or where an execution is not
deemed benecial are automatically routed to the standard engine.
180
PUBLIC
SAP HANA Troubleshooting and Performance Analysis Guide
Root Causes and Solutions
If necessary (for example, if recommended by SAP Support), you can set conguration parameters to
completely disable these engines. Each engine has a single parameter which can be switched to disable it:
File Section Parameter Value Meaning
indexserver.ini sql esx_level Default 1, set to 0 to
disable.
Extended SQL executor enabled.
indexserver.ini sql hex_enabled Default True, set to
False to disable.
HANA execution engine enabled.
These engines should not be disabled permanently because they are being actively developed and improved in
each release.
Query Hints
Further control of how these engines are used is available (from SPS 02.01) using hints with queries to
explicitly state which engine should be used to execute the query. For each engine two hint values are available
to either use or completely ignore the engine. The following table summarizes these and is followed by
examples:
Hint value Eect
USE_ESX_PLAN Guides the optimizer to prefer the ESX engine over the standard engine.
NO_USE_ESX_PLAN Guides the optimizer to avoid the ESX engine.
USE_HEX_PLAN Guides the optimizer to prefer the HEX engine over the standard engine.
NO_USE_HEX_PLAN Guides the optimizer to avoid the HEX engine.
Example
SELECT * FROM T1 WITH HINT(USE_ESX_PLAN);
SELECT * FROM T1 WITH HINT(NO_USE_HEX_PLAN);
Similar hints are available for the OLAP engine as described later in this section: Using Hints to Alter a Query
Plan.
Related Information
Using Hints to Alter a Query Plan
SAP HANA Troubleshooting and Performance Analysis Guide
Root Causes and Solutions
PUBLIC 181
3.14.1SQL Statement Optimization
This section provides an overview of tools, traces and SAP HANA cockpit areas that can be used to identify
critical SQL statements.
SQL statements that are not executed eciently can cause local and system-wide problems. The most critical
are the following areas:
• A long runtime can result in delays of the business activities
• A high CPU consumption can lead to system-wide CPU bottlenecks
• High memory consumption can be responsible for out-of-memory situations and performance penalties
due to unload of tables from memory
SQL statements consuming signicant resources are called expensive SQL statements.
Identication of Critical SQL Statements
A key step in identifying the source of poor performance is to understand how much time is spent in the SAP
HANA engine for query execution. By analyzing SQL statements and calculating their response times, you can
better understand how the statements aect application and system performance.
Before you are able to analyze and optimize a SQL statement, you have to identify the critical SQL statements.
We can distinguish between the following scenarios:
• SQL statements that have caused problems in the past
• SQL statements that are currently causing problems
3.14.1.1SQL Statements Responsible for Past Problems
Sometimes it is not possible to identify a critical SQL statement during runtime. In this case you can use the
following approaches to identify one or several SQL statements that can have contributed to the problem.
You can identify a SQL statement either by its SQL text (“statement string”) or by the related statement hash
that is uniquely linked to an individual SQL text. The mapping of the statement hash to the actual SQL text is
described later.
To determine SQL statements with a particularly high runtime you can check for the top SQL statements in
terms of TOTAL_EXECUTION_TIME on the SQL Plan Cache page in the SAP HANA cockpit.
To determine the top SQL statements that were executed during a dedicated time frame in the past,
you can check the SQL plan cache history (HOST_SQL_PLAN_CACHE). You can use the SQL statement:
“HANA_SQL_SQLCache” available from SAP Note 1969700 – SQL Statement Collection for SAP HANA in order
to check for top SQL statements during a specic time frame:
You have to specify a proper BEGIN_TIME / END_TIME interval and typically use ORDER_BY = ‘ELAPSED’, so
that the SQL statements with the highest elapsed time from SAP HANA are returned.
182
PUBLIC
SAP HANA Troubleshooting and Performance Analysis Guide
Root Causes and Solutions
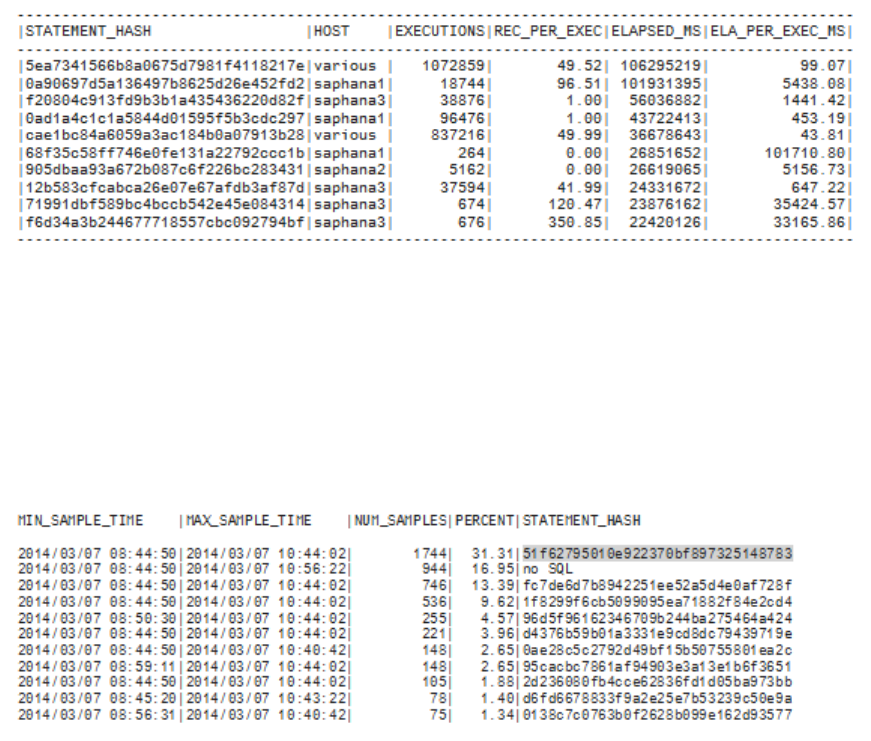
SQL Statements With Highest Elapsed Time
The thread sample history (tables M_SERVICE_THREAD_SAMPLES, HOST_SERVICE_THREAD_SAMPLES),
if available, can also be used to determine the top SQL statements. You can use the SQL statement:
“HANA_Threads_ThreadSamples_FilterAndAggregation” available from SAP Note 1969700 – SQL Statement
Collection for SAP HANA in order to check.
You have to specify a proper BEGIN_TIME / END_TIME interval and use AGGREGATE_BY =
‘STATEMENT_HASH’ to identify the top SQL statements during the time frame.
SQL Example Output
In this case the SQL statement with hash 51f62795010e922370bf897325148783 is executed most often and
so the analysis should be started with it. Often you need to have a look at some more SQL statements,
for example the statements related to the next statement hashes fc7de6d7b8942251ee52a5d4e0af728f and
1f8299f6cb5099095ea71882f84e2cd4.
In cases where the M_SERVICE_THREAD_SAMPLES / HOST_SERVICE_THREAD_SAMPLES information is not
usable you can use the thrloop.sh script to regularly collect thread samples as described in SAP Note
1989031 – Scheduling of Shell script “thrloop.sh”.
In case of an out-of-memory (OOM) situation you can determine potentially responsible SQL statements by
analyzing the OOM dump le(s) as described in SAP Note 1984422 – Analysis of HANA Out-of-memory (OOM)
Dumps.
SAP HANA Alert 39 (“Long-running statements”) reports long-running SQL statements and records them
in the table _SYS_STATISTICS.HOST_LONG_RUNNING_STATEMENTS. Check the contents of this table to
determine details of the SQL statements that caused the alert. See also KBA 1849392 - HANA alerts related to
locks, hanging sessions and long runners.
SAP HANA Troubleshooting and Performance Analysis Guide
Root Causes and Solutions
PUBLIC 183

Related Information
SAP Note 1969700
SAP Note 1989031
SAP Note 1984422
SAP Note 1849392
3.14.1.2SQL Statements Responsible for Current Problems
If problems like high memory consumption, high CPU consumption or a high duration of individual database
requests are currently happening, you can determine the active SQL statements with the help of SAP HANA
cockpit.
Check for the currently running SQL statements in SAP HANA cockpit by clicking on the Threads tile.
Tracing
You can also activate the following traces to capture more detailed information to help identify critical SQL
statements:
• SQL trace can be used to capture performance data for all SQL statements, you can use lter conditions to
limit the trace activities.
• Expensive statements trace captures all SQL statements with a runtime beyond a dened threshold.
Further details can be found in Tools and Tracing.
Related Information
Tools and Tracing [page 237]
3.14.2Analysis of Critical SQL Statements
When you have identied the SQL text and the related statement hash based on the tools and traces, you
can collect more information about the SQL statement in order to identify the root cause of the performance
problem and optimize the statement. The available analysis approaches are described here.
From a technical perspective, analyzing query plans allows you to identify long running steps, understand how
much data is processed by the operators, and see whether data is processed in parallel.
However, if you understand the idea and purpose behind the query, you can also analyze query plans from a
logical perspective and consider the following questions to gain the insight you need:
184
PUBLIC
SAP HANA Troubleshooting and Performance Analysis Guide
Root Causes and Solutions
• Does SAP HANA read data from multiple tables when only one is required?
• Does SAP HANA read all records when only one is required?
• Does SAP HANA start with one table even though another table has a much smaller result set?
The following tools can be used for a more detailed analysis:
• Plan Explanation - used to evaluate the execution plan;
• SQL analyzer - provides a detailed graphical execution plan with a timeline;
• Query optimizer (QO) Trace - an advanced tool that can be useful to understand the decisions of the query
optimizer and column searches;
• Join evaluation (JE) Trace - an advanced tool to analyze table join operations;
• Performance trace - this advanced tool should only be used in collaboration with SAP support, it gives low
level recording of key performance indicators for individual SQL statement processing steps;
• Kernel proler - this advanced tool should only be used in collaboration with SAP support, it performs
sample based proling of SAP HANA process activities.
Related Information
Analyzing SQL Execution with the Plan Explanation [page 248]
Analyzing SQL Execution with the Plan Visualizer [page 252]
Analyzing Column Searches (qo trace) [page 281]
Analyzing Table Joins [page 282]
Performance Trace [page 288]
Kernel Proler [page 290]
3.14.2.1SQL Plan Cache Analysis
The SAP HANA SQL plan cache can be evaluated in detail for a particular statement hash.
Various options are available for analyzing the plan cache for a statement. In SAP HANA cockpit the link for
SQL Plan Cache is available in the Monitoring tile. The two system views associated with the SQL plan cache are
M_SQL_PLAN_CACHE_OVERVIEW and M_SQL_PLAN_CACHE.
Alternatively, SQL statements for this are available in SAP Note 1969700 – SQL Statement Collection for SAP
HANA. You can use the “HANA_SQL_StatementHash_KeyFigures” script to check for the SQL plan cache
details of a specic SQL statement (the related STATEMENT_HASH has to be maintained as input parameter).
SAP HANA Troubleshooting and Performance Analysis Guide
Root Causes and Solutions
PUBLIC 185
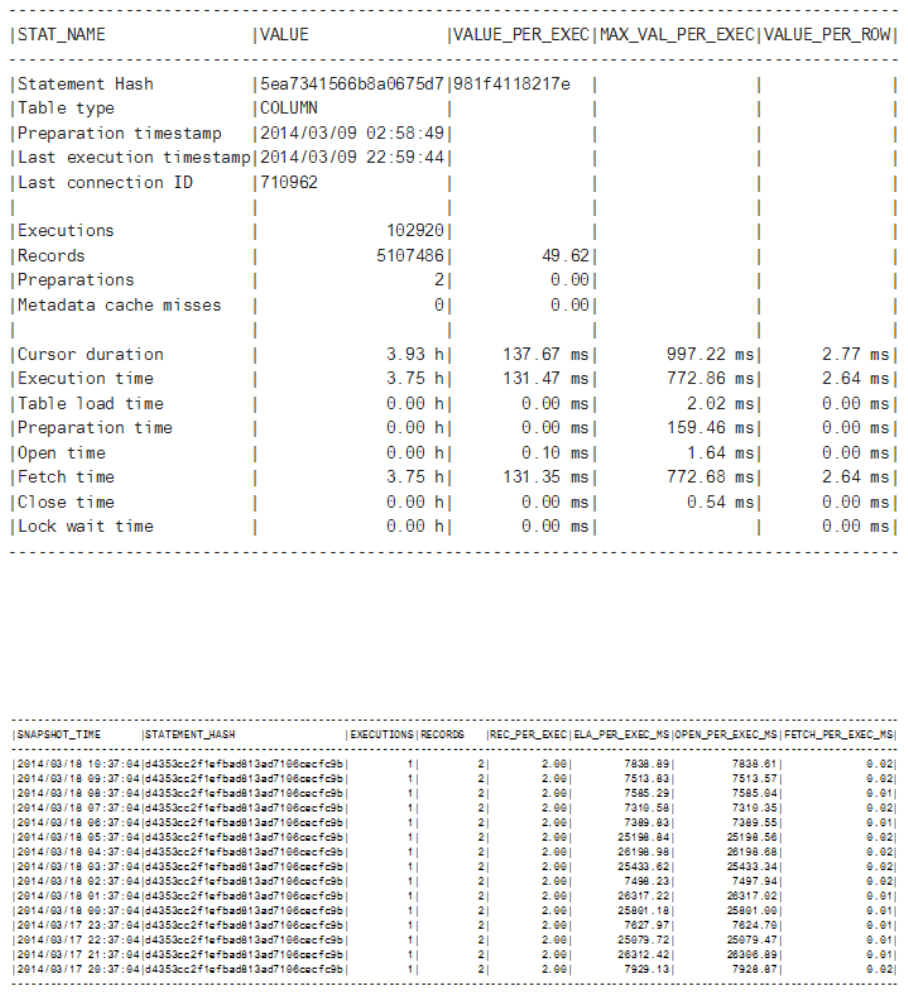
SQL PLAN Cache Example Output
The historic execution details for a particular SQL statement can be determined with the SQL statement:
“HANA_SQL_SQLCache”. Also here the appropriate STATEMENT_HASH has to be specied as input
parameter.
Statement Hash Example output
Based on the results of this evaluation you can distinguish the following situations:
• If the value for Executions is unexpectedly high, further analysis should be done on the application side in
order to check if it is possible to reduce the number of executions.
• If the value for Records is unexpectedly high, further analysis should be done on the application side in
order to check if it is possible to reduce the number of selected records.
• If the value for Cursor duration is very high and at the same time signicantly higher than the value for
Execution time, you have to check which processing steps are executed on the application side between
the individual fetches. A high value for Cursor duration can negatively impact the database in general
because open changes may impact the MVCC mechanism.
186
PUBLIC
SAP HANA Troubleshooting and Performance Analysis Guide
Root Causes and Solutions
• If the value for Preparation time is responsible for a signicant part of the Execution time value you have to
focus on optimizing the parsing (for example, sucient SQL plan cache size, reuse of already parsed SQL
statements).
• If Execution time is much higher than expected (that can be based on the statement complexity and the
number of processed rows), the SQL statement has to be checked more in detail on technical layer to
understand the reasons for the high runtime. See section Query Plan Analysis for more information.
Related Information
SAP Note 1969700
Query Plan Analysis [page 248]
Analyzing SQL Execution with the SQL Plan Cache [page 246]
3.14.2.1.1Example: Reading the SQL Plan Cache
These examples aim to show you how to gain useful insights by analyzing the SQL plan cache.
Execution in a Single-Host System
This example aims to show you how to interpret information about execution time. The following table is sorted
by TOTAL_EXECUTION_TIME.
USER_
NAME STATEMENT_ STRING
TOTAL_ EXECUTION_
TIME
AVG_ EXECUTION_
TIME EXECUTION_ COUNT
SYSTEM
SELECT "REQUEST" ,
"DATAPAKID" ,
"PARTNO" , "RECORD" ,
"CALDAY" , ...
774,367,833 181,266 4,272
SYSTEM
SELECT * FROM "/BIC/
AZDSTGODO40" WHERE "SID"
= ?
726,672,877 60,556,073 12
SYSTEM
SELECT "JOBNAME" ,
"JOBCOUNT" ,
"JOBGROUP" ,
"INTREPORT" ,
"STEPCOUNT" ...
473,620,452 22,987 20,604
– <Further 6832 records> – – –
You could read these top 3 results as follows:
• Statement 1 takes the longest time overall but it is also executed frequently.
SAP HANA Troubleshooting and Performance Analysis Guide
Root Causes and Solutions
PUBLIC 187

• Statement 2 is not executed very frequently but has the second highest total execution time. Why is this
simple SQL taking so long? Does it have problems processing?
• The execution times for statement 3 are ne for one-o execution, but it runs too frequently, over 20,000
times. Why? Is there a problem in application code?
Sorting by AVG_EXECUTION_TIME or EXECUTION_COUNT provides a dierent angle on your analysis.
The following example aims to show you how to interpret information about locking situations. The information
in columns TOTAL_LOCK_WAIT_COUNT and TOTAL_LOCK_WAIT_DURATION lets us know which statement is
waiting for others and how much time it takes.
USER STATEMENT_STRING
TOTAL_LOCK_
WAIT_COUNT
TOTAL_LOCK_
WAIT_DURATION
TOTAL_ EXECU-
TION_TIME
SYSTEM
SELECT
"FROMNUMBER","TONUMBER",
"NRLEVEL" FROM
"NRIV" ... FOR UPDATE
11,549,961 210,142,307,207 676,473
SYSTEM
UPDATE "NRIV" SET
"NRLEVEL" = ? WHERE
"CLIENT" = '000' ... AND
"TOYEAR" = '0000'
0 0 3,706,184
SYSTEM
SELECT "DIMID" FROM
"/BIC/DZDSTGCUBE4" WHERE
"/B49/S_VERSION" = ?
0 0 460,991
Here, it is clear that the rst statement is waiting almost all the time. Known as pessimistic/optimistic
locking, the SELECT...FOR UPDATE code locks the resulting columns and may be replaced by a non-locking
variant, which can result in poor performance. If the application is critical, it may be necessary to revise the
SELECT...FOR UPDATE code for better resource utilization and performance.
Execution in a Distributed System
In distributed SAP HANA systems, tables and table partitions are located on multiple hosts. The execution
of requests received from database clients may potentially have to be executed on multiple hosts, depending
on where the requested data is located. The following example illustrates statement routing and how, if it is
not enabled, requests from the database client are executed on the contacted index server (in this case the
master index server) and the required data is fetched from the index server on the relevant host(s). However, if
statement routing is enabled, after initial query compilation, request execution is routed directly to the host on
which the required data is located.
Distributed Execution with Statement Routing O and On
188
PUBLIC
SAP HANA Troubleshooting and Performance Analysis Guide
Root Causes and Solutions
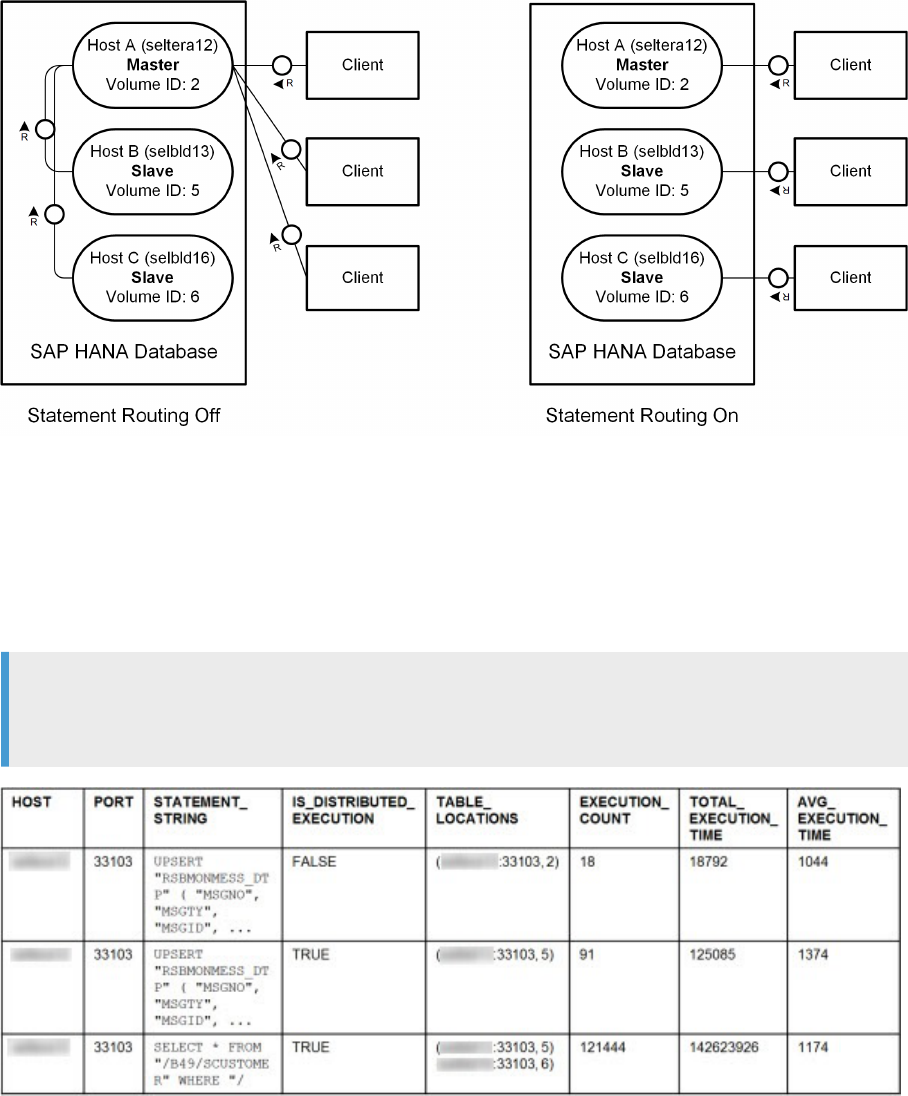
Execution times should be better with statement routing enabled. You can use the SQL plan cache to compare
the execution statistics of statements with statement routing enabled and disabled and thus conrm the eect.
Statement routing is controlled by the client_distribution_mode parameter in the indexserver.ini
le. It is enabled by default (value=statement).
The following SQL plan cache examples show the execution times of sample statements based on the scenario
illustrated above with hosts A, B and C.
Note
The column IS_DISTRIBUTED_EXECUTION indicates whether or not statement execution takes place on
more than one host.
SAP HANA Troubleshooting and Performance Analysis Guide
Root Causes and Solutions
PUBLIC 189
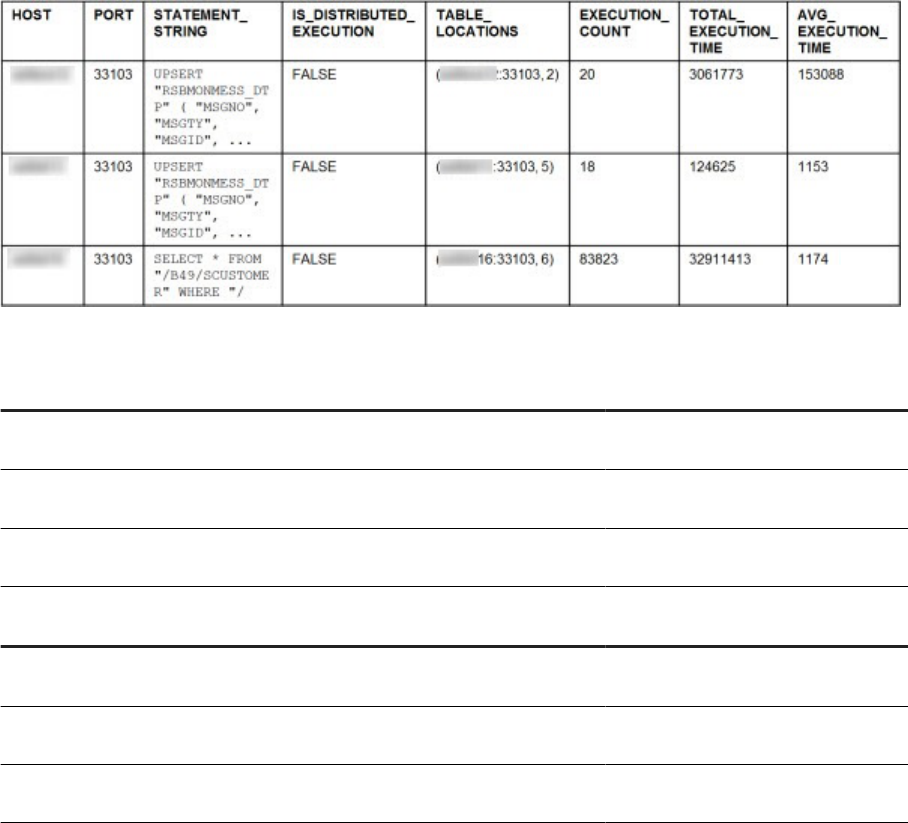
The TOTAL_EXECUTION_TIME for a statement is the sum of execution times on all hosts, therefore:
Statement
Request Path Total Execution Time
UPSERT "RSBMONMESS_DTP"
( "MSGNO", "MSGTY", "MSGID", ...
Host A = execution time on Host A
SELECT * FROM "/BI0/SIOBJNM"
WHERE "IOBJNM" = ?
Host A > Host B = execution time on Host A + execution
time on Host B
SELECT * FROM "/B49/SCUSTOMER"
WHERE "/B49/S_CUSTOMER" = ?
Host A > Host B > Host C = execution time on Host B + execution
time on Host C
Statement Request Path Total Execution Time
UPSERT "RSBMONMESS_DTP"
( "MSGNO", "MSGTY", "MSGID", ...
Host A = execution time on Host A
SELECT * FROM "/BI0/SIOBJNM"
WHERE "IOBJNM" = ?
Host B = execution time on Host B
SELECT * FROM "/B49/SCUSTOMER"
WHERE "/B49/S_CUSTOMER" = ?
Host C = execution time on Host C
3.14.3Optimization of Critical SQL Statements
You can improve the general performance of the SAP HANA database by implementing various best practices,
design principles, available features, and add-ons.
To enhance the performance of the SAP HANA database, we recommend you do the following:
• Optimize outlier queries
Queries that sometimes take much longer than expected can be caused by query-external factors (for
example, resource bottlenecks) that have to be determined and eliminated.
• Check data manipulation commands (DML)
DML operations like INSERT, UPDATE and DELETE can be impacted by lock waits.
• Create indexes for any non-primary key columns that are often queried.
SAP HANA automatically creates indexes for primary key columns; however, if you need indexes for
non-primary key columns, you must create them manually.
190
PUBLIC
SAP HANA Troubleshooting and Performance Analysis Guide
Root Causes and Solutions

• Use native HANA models
Develop native HANA models and graphical calculation views in the SAP Web IDE to take advantage of the
latest performance optimization capabilities.
• Develop procedures to embed data-intensive application logic into the database.
With procedures, no large data transfers to the application are required and you can use performance-
enhancing features such as parallel execution.
• If you use SQLScript to create procedures, follow the best practices for using SQLScript.
• For statistical computing, create procedures using the open source language R.
• Download and install the available application function libraries, such as Predictive Analysis Library (PAL)
and Business Function Library (BFL).
Application functions are like database procedures written in C++ and called from outside to perform data
intensive and complex operations.
• Scale SAP HANA to improve performance.
SAP HANA's performance is derived from its ecient, parallelized approach. The more computation cores
your SAP HANA server has, the better overall system performance is.
Note
With SAP HANA, you do not need to perform any tuning to achieve high performance. In general, the SAP
HANA default settings should be sucient in almost any application scenario. Any modications to the
predened system parameters should only be done after receiving explicit instruction from SAP Support.
3.14.3.1Outlier Queries
Outlier queries are database statements that take much more time than usual and expected. This usually
happens because extra work has to be performed during execution.
Besides heavy load on the machine by non-SAP HANA processes (which should not be the case on production
systems) SAP HANA itself can be under heavy load. Reasons include:
• Many users are connected and issue a large amount of statements
• Extraordinary expensive statements are executed
• Background tasks are running
SAP HANA Troubleshooting and Performance Analysis Guide
Root Causes and Solutions
PUBLIC 191
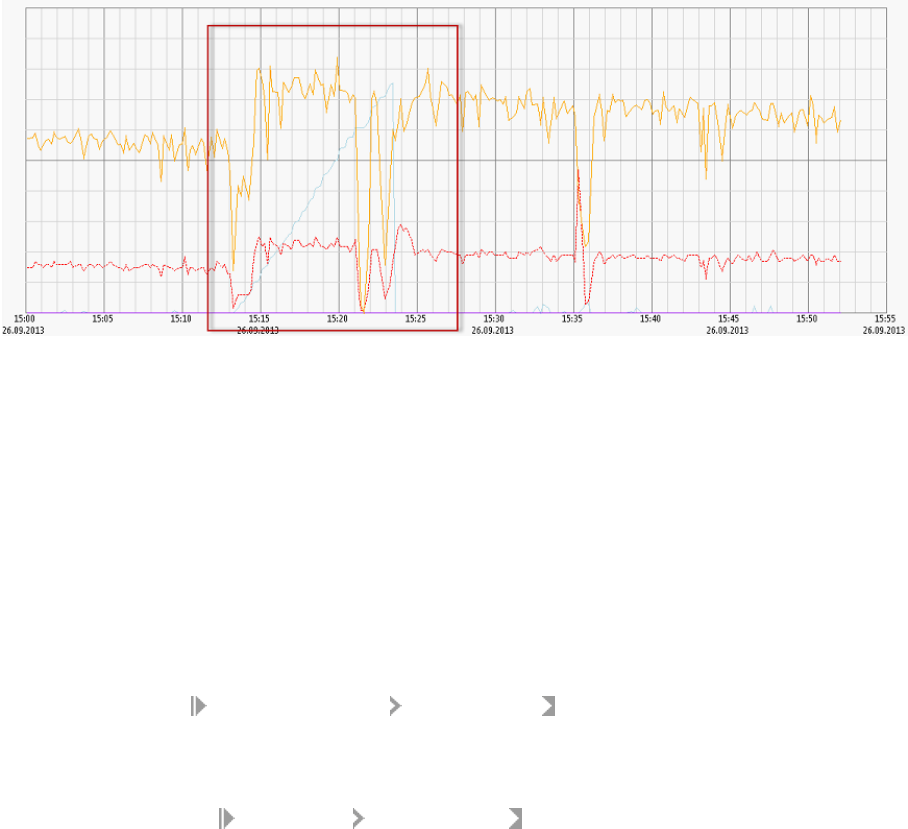
Use the Performance Monitor to determine the number of statements issued and the indexserver CPU usage
while the slow statement execution was perceived (see the gure CPU Consumption and SQL Throughput, the
lower line (red) is the CPU consumption in percent (%), the upper line (orange) is the SQL throughput / s):
CPU Consumption and SQL Throughput
You can see that during the period in the red rectangle both CPU consumption and SQL throughput decreased.
During that time frame you would look for something that consumed a lot of resources or blocked the
statements (locking); just after 15:35 you see that the CPU consumption increases while the SQL throughput
decreases. Here, a possible case would be a change in usage: instead of many small, fast SQL statements the
workload changed to a few "heavy" (complicated calculation requiring many CPU cycles) SQL statements.
If there was a high statement load in the same period when you experienced the slow execution, the root cause
is likely a lack of resources. To resolve the situation consider restricting the number of users on SAP HANA or
upgrading the hardware. See Getting Support for further help, for example if you need to improve scalability.
If you did not experience a high statement load during the time frame of the problem, check for background
activities:
• Delta Merges: Use Performance Monitor Merge Requests and the monitoring view
M_DELTA_MERGE_STATISTICS to check if delta merges happened. In that case try to improve the delta
merge strategy to prevent merges happening in phases where users are disturbed (see the SAP HANA
Administration Guide for details).
• Column Unloads: See Load Monitor Column Unloads and the monitoring view M_CS_UNLOADS to
look for signs of column unloads. If a column used in the problematic statement had to be loaded before
execution, the execution itself will take signicantly longer.
• Savepoints: Savepoints consume resources and write-lock the database during their critical phase. Check
M_SAVEPOINTS and look for savepoints during the time frame of the problem. If a savepoint slowed down
your execution, the chance of having the same problem again is very low. If it happens often, see Getting
Support for further help.
Related Information
M_DELTA_MERGE_STATISTICS
M_CS_UNLOADS
M_SAVEPOINTS
192
PUBLIC
SAP HANA Troubleshooting and Performance Analysis Guide
Root Causes and Solutions
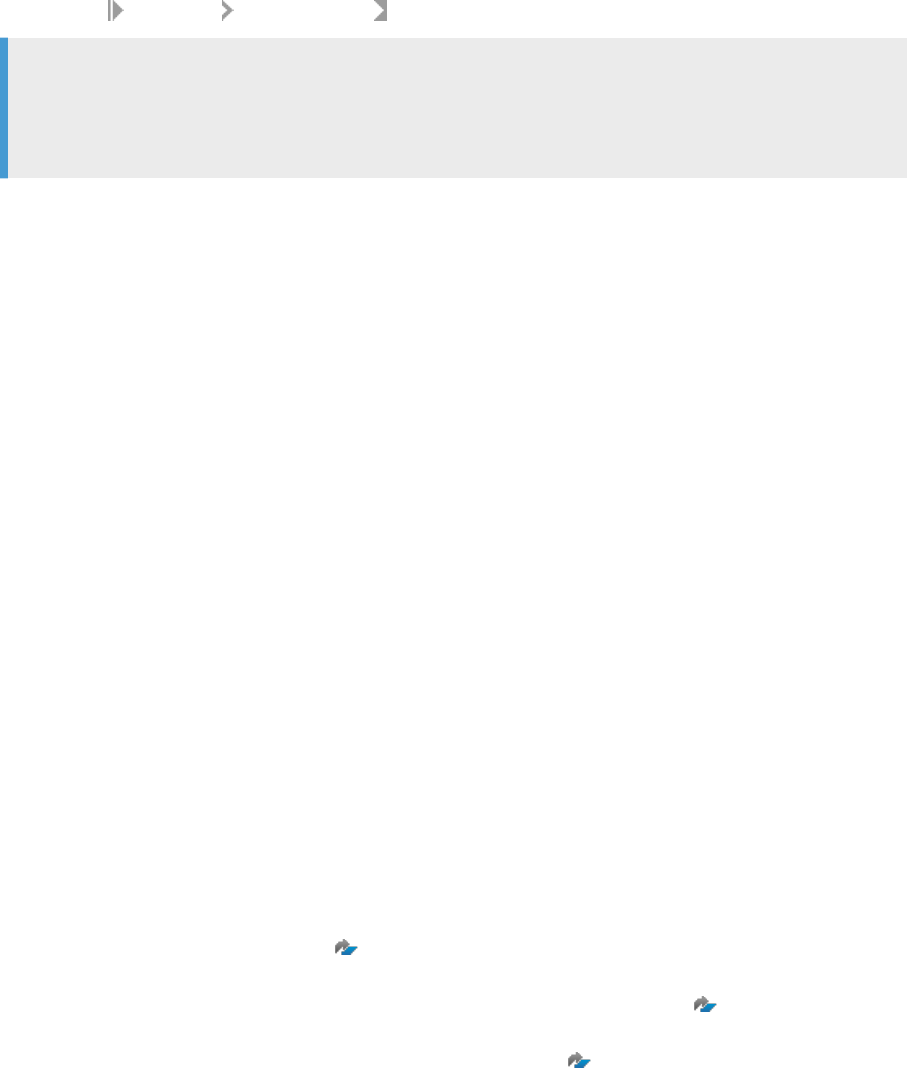
Getting Support
3.14.3.2Data Manipulation Language (DML) Statements
Data Manipulation Language (DML) statements are often slowed down by lock-wait situations.
Check under Monitoring SQL Plan Cache and the view M_SQL_PLAN_CACHE to determine such issues:
Note
Only check entries that have TOTAL_LOCK_WAIT_COUNT greater than 0. For those entries, compare the
column MAX_CURSOR_DURATION against AVG_CURSOR_DURATION. If there is a signicant dierence,
there was at least one situation where the transactions took much longer than average.
See Transactional Problems for information on how to deal with such issues.
Related Information
M_SQL_PLAN_CACHE
Transactional Problems [page 167]
3.14.3.3Native HANA Models
Creating native HANA models can be one way to improve performance compared to development options
outside of the database, or in some cases also compared to pure SQL development.
Native HANA models can be developed in the new XS Advanced (XSA) development environment using SAP
Web IDE for SAP HANA. These models supersede older artifacts like Analytic and Attribute Views; these views
should now be replaced by graphical Calculation Views which can be used to model complex OLAP business
logic. Native HANA modeling provides various options to tune performance by, for example, helping to achieve
complete unfolding of the query by the calculation engine or modeling join cardinalities between two tables
(that is, the number of matching entries (1...n) between the tables) and optimizing join columns.
For more information about modeling graphical calculation views refer to the SAP HANA Modeling Guide for
SAP Web IDE for SAP HANA.
A number of blogs are available about the details of modeling:
• https://blogs.sap.com/2017/09/01/overview-of-migration-of-sap-hana-graphical-view-models-into-the-
new-xsa-development-environment/
Overview: Migration of Models into the XSA Development
Environment
• https://blogs.sap.com/2017/10/27/join-cardinality-setting-in-calculation-views/ Join cardinality setting
in Calculation Views
• https://blogs.sap.com/2018/08/10/optimize-join-columns-ag/ Optimize Join Columns Flag
SAP HANA Troubleshooting and Performance Analysis Guide
Root Causes and Solutions
PUBLIC 193

The following SAP Notes provide further background information:
• https://launchpad.support.sap.com/#/notes/2441054 2441054 - High query compilation times and
absence of plan cache entries for queries against calculation views.
• https://launchpad.support.sap.com/#/notes/2465027 2465027 - Deprecation of SAP HANA extended
application services, classic model and SAP HANA Repository.
Related Information
SAP HANA Modeling Guide for SAP Web IDE for SAP HANA
3.14.3.4Developing Procedures
SQL in SAP HANA includes extensions for creating procedures, which enables you to embed data-intensive
application logic into the database, where it can be optimized for performance (since there are no large data
transfers to the application and features such as parallel execution is possible). Procedures are used when
other modeling objects, such as views, are not sucient; procedures are also often used to support the
database services of applications that need to write data into the database.
Reasons to use procedures instead of standard SQL, include:
• SQL is not designed for complex calculations, such as for nancials.
• SQL does not provide for imperative logic.
• Complex SQL statements can be hard to understand and maintain.
• SQL queries return one result set. Procedures can return multiple result sets.
• Procedures can have local variables, eliminating the need to explicitly create temporary tables for
intermediate results.
Procedures can be written in the following languages:
• SQLScript: The language that SAP HANA provides for writing procedures.
• R: An open-source programming language for statistical computing and graphics, which can be installed
and integrated with SAP HANA.
There are additional libraries of procedures, called Business Function Library and Predictive Analysis Library,
that can be called via SQL or from within another procedure.
HANA Database Explorer
HANA Database Explorer provides a comprehensive set of development tools that allow you to evaluate, revise,
and optimize stored procedures. You can browse through the objects in the schema to locate the procedures,
from there, a number of options are available from the context menu. Features include a code editor for
running and testing procedures as well as debugging and SQLScript analysis tools. Refer to the documentation
sections on Database Explorer in the SAP HANA Administration Guide for more details.
194
PUBLIC
SAP HANA Troubleshooting and Performance Analysis Guide
Root Causes and Solutions

SQL Extensions for Procedures
SQL includes the following statements for enabling procedures:
• CREATE TYPE: Creates a table types, which are used to dene parameters for a procedure that represent
tabular results. For example:
CREATE TYPE tt_publishers AS TABLE (
publisher INTEGER,
name VARCHAR(50),
price DECIMAL,
cnt INTEGER);
• CREATE PROCEDURE: Creates a procedure. The LANGUAGE clause species the language you are using to
code the procedure. For example:
CREATE PROCEDURE ProcWithResultView(IN id INT, OUT o1 CUSTOMER)
LANGUAGE SQLSCRIPT READS SQL DATA WITH RESULT VIEW ProcView AS
BEGIN
o1 = SELECT * FROM CUSTOMER WHERE CUST_ID = :id;
END;
• CALL: Calls a procedure. For example:
CALL getOutput (1000, 'EUR', NULL, NULL);
Related Information
Create and Edit Procedures
Open the SAP HANA Database Explorer (SAP HANA Cockpit)
3.14.3.5Application Function Library (AFL)
You can dramatically increase performance by executing complex computations in the database instead of at
the application server level.
SAP HANA provides several techniques to move application logic into the database, and one of the most
important is the use of application functions. Application functions are like database procedures written in C++
and called from outside to perform data intensive and complex operations. Functions for a particular topic
are grouped into an application function library (AFL), such as the Predictive Analytical Library (PAL) or the
Business Function Library (BFL).
Currently, all AFLs are delivered in one archive (that is, one SAR le with the name AFL<version_string>.SAR).
Note
The AFL archive is not part of the SAP HANA appliance, and must be installed separately by an
administrator. For more information about installing the AFL archive, see the SAP HANA Server Installation
and Update Guide.
SAP HANA Troubleshooting and Performance Analysis Guide
Root Causes and Solutions
PUBLIC 195

Security Considerations
• User and Schema
During startup, the system creates the user _SYS_AFL, whose default schema is _SYS_AFL.
Note
The user and its schema _SYS_AFL are created during a new installation or update process if they do
not already exist.
All AFL objects, such as areas, packages, functions, and procedures, are created under this user and
schema. Therefore, all these objects have fully specied names in the form of _SYS_AFL.<object name>.
• Roles
For each AFL library, there is a role. You must be assigned to this role to execute the functions in the library.
The role for each library is named: AFL__SYS_AFL_<AREA NAME>_EXECUTE. For example, the role for
executing PAL functions is AFL__SYS_AFL_AFLPAL_EXECUTE.
Note
There are 2 underscores between AFL and SYS.
Note
Once a role is created, it cannot be dropped. In other words, even when an area with all its objects is
dropped and recreated during system start-up, the user still keeps the role that was previously granted.
3.14.3.6Aspects of Scalability
Before you decide how to scale your SAP HANA implementation, there are a number of aspects that need to be
considered, such as scaling data, performance, applications, and hardware.
Scaling the Data
One technique you can use to deal with planned data growth is to purchase more physical RAM than is initially
required to set the allocation limit according to your needs, and then to increase it over time to adapt to your
data. Once you have reached the physical limits of a single server, you can scale out over multiple machines
to create a distributed SAP HANA system. You can do this by distributing dierent schemas and tables to
dierent servers (complete data and user separation). However, this is not always possible, for example, when
a single fact table is larger than the server's RAM size.
The most important strategy for scaling your data is data partitioning. Partitioning supports the creation
of very large tables (billions of rows) by breaking them into smaller chunks that can be placed on dierent
machines. Partitioning is transparent for most SQL queries and other data manipulations.
For more information, see the section on managing tables.
196
PUBLIC
SAP HANA Troubleshooting and Performance Analysis Guide
Root Causes and Solutions

Scaling Performance
SAP HANA's performance is derived from its ecient, parallelized approach. The more computation cores your
SAP HANA server has, the better the overall system performance is.
Scaling performance requires a more detailed understanding of your workload and performance expectations.
Using simulations and estimations of your typical query workloads, you can determine the expected load that a
typical SAP HANA installation may comfortably manage. At the workload level, a rough prediction of scalability
can be established by measuring the average CPU utilization while the workload is running. For example, an
average CPU utilization of 45% may indicate that the system can be loaded 2X before showing a signicant
reduction in individual query response time.
For more information, see the sections on workload management and performance analysis.
Scaling the Application
Partitioning can be used to scale the application as it supports an increasing number of concurrent sessions
and complex analytical queries by spreading the calculations across multiple hosts. Particular care must
be taken in distributing the data so that the majority of queries match partitioning pruning rules. This
accomplishes two goals: directing dierent users to dierent hosts (load balancing) and avoiding the network
overhead related to frequent data joins across hosts.
Scaling Hardware
SAP HANA is oered in a number of ways – in the form of an on-premise appliance, delivered in a number
of dierent congurations and "sizes" by certied hardware partners or by using the tailored data center
integration model, and as part of a cloud-based service. This creates dierent system design options with
respect to scale-up and scale-out variations. To maximize performance and throughput, SAP recommends
that you scale up as far as possible (acquire the conguration with the highest processor and memory
specication for the application workload), before scaling out (for deployments with even greater data volume
requirements).
Note
The SAP HANA hardware partners have dierent building blocks for their scale-out implementations.
Therefore, you should always consult with your hardware partner when planning your scale-out strategy.
Related Information
Table Partitioning
Workload Management
Managing and Monitoring SAP HANA Performance
SAP HANA Troubleshooting and Performance Analysis Guide
Root Causes and Solutions
PUBLIC 197
3.14.3.7Further Recommendations
In addition to the general recommendations for improving SAP HANA database performance, for specic
scenarios, you can use further features and best practices to improve performance.
If appropriate, you can take the following actions to improve performance:
• For any required long-running transactions, you can use the SQL command ALTER SYSTEM RECLAIM
VERSION SPACE to trigger the row store garbage collector to free up memory space and enhance system
responsiveness.
• For multicolumn join scenarios, use dynamic joins rather than standard joins.
In a dynamic join, the elements of a join condition between two data sources are dened dynamically based
on the elds requested by the client query. It is used to improve the performance by reducing the number
of records to be processed by the join node.
• When inserting or loading a large number of rows into a table that has a TEXT or SHORTTEXT column or
uses a FULLTEXT INDEX, merge the delta of the table for better search performance.
• When loading data from CSV les using the IMPORT FROM command, use THREADS and BATCH to enable
parallel loading and commit many records at once. In general, for column tables, a good setting to use is
10 parallel loading threads, with a commit frequency of 10,000 records or greater. You can also use TABLE
LOCK, which locks the entire table and bypasses the delta table. Table locks are only recommended for
initial loads.
3.15 Application Performance Analysis
This section provides a high-level guide for analyzing the performance of SAP HANA-based applications.
When you have an SAP HANA-based application with unsatisfying performance, you should start a systematic
investigation considering the various layers that are involved. Here we focus on the database layer; approaches
for analyzing UI and application server performance are described in the respective documents.
3.15.1SQL Trace Analysis
The rst step in application performance analysis is to gure out if the database layer is causing performance
problems for your application at all.
Context
You should analyze how many and which database calls are made and what their contribution to the overall
application performance is. This should be done within the context of a given user interface step or transaction.
198
PUBLIC
SAP HANA Troubleshooting and Performance Analysis Guide
Root Causes and Solutions
Procedure
1. Start the tracing of database calls.
2. Run the application from its user interface or with any other driver.
Both, SAP HANA cockpit and SAP Web IDE for SAP HANA provide two main tracing tools, namely SQL
trace and Expensive statements trace.
A convenient way to narrow the trace analysis to the scope of a user interface step or transaction is to use
the passport-based ltering of Expensive statements trace in the SAP Web IDE for SAP HANA, which also
oers aggregated statistics to quickly answer above questions.
Deep tracing (including complete execution plans) is provided by Plan trace in SAP HANA cockpit.
3. Terminate the tracing and review aggregated and individual results.
4. As a result of this investigation you might see some indicators for bad application logic creating excessive
load on the database such as:
• Too many database calls (per transaction/UI step)
• Many identical executions, for example repeated identical selects
• Too many records returned (per execution or in total)
• Too many columns or all columns of a row selected
• Inecient statement reuse, that is, statements that need to be optimized over and over again
• One or more database calls with unexpected bad performance, so you should further investigate those
calls
Related Information
Plan Trace [page 264]
Analyzing SQL Traces [page 238]
Expensive Statements Trace [page 243]
3.15.2Statement Measurement
Once you have determined which SQL statements are problematic you should rst perform a sound
measurement in order to get reliable performance numbers and to make sure that indeed your statements
are causing the issues and not the current state of your SAP HANA system.
Procedure
1. Execute your statements and measure their performance (in particular response time).
SAP HANA cockpit oers basic measurement of SQL statements. In addition, the SAP HANA database
explorer and the SQL analyzer support executing and analyzing SQL statements.
SAP HANA Troubleshooting and Performance Analysis Guide
Root Causes and Solutions
PUBLIC 199

2. Check your SAP HANA system status for disturbing conditions, such as high load, high resource usage and
so on.
3. In case of disturbing conditions repeat your measurement from step 1.
4. Repeat your measurements until you get stable results without major variations (for example, 3 stable
executions in a row).
Note
Higher initial response times could be an indicator of caches that are not properly lled. Depending on
your business needs you can decide whether this is acceptable or not.
5. Once you have a stable result you may also acquire a detailed SAP HANA engine trace which will allow for a
deeper analysis.
Results
As a result of this activity you have reliable data for your query performance, both for initial query execution
performance (possibly cold execution) and stabilized execution performance (warm execution).
Related Information
Statement Performance Analysis [page 180]
3.15.3Data Analysis
The easiest way to analyze a poorly performing SQL statement is to look at the data ow as this can be
matched with the understanding of the business/application needs.
Procedure
1. Check the result size, that is the number of records and number of columns, returned by your SQL
statement and compare it with the actual business needs.
As a result of this investigation you might restrict the result size by changing the application logic (for
example, the number of columns selected in the eld list or by applying additional lters in the WHERE
clause) with regards to its database call.
2. Check the usage of underlying tables, meaning the set of tables used, their size and the number of entries
selected from those tables, and compare it with your understanding of the business needs.
As a result of this investigation you might identify tables that should not be involved at all and adapt your
statement or the underlying database logic accordingly (for example, by checking joins and join types).
SAP HANA cockpit oers data ow analysis with the Tables Used view in the SQL analyzer.
200
PUBLIC
SAP HANA Troubleshooting and Performance Analysis Guide
Root Causes and Solutions

3. Check the data ow of your statement, that is, the order in which tables are joined, how lters are applied
and the size of intermediate results.
As a result of this investigation you may identify:
• inecient join orders (starting with table A and not with table B, when that is the much smaller result
set)
• unexpectedly missing lters (that is, intermediate selections which seem too broad).
You can then adapt your statement or underlying database logic as necessary.
SAP HANA cockpit oers data ow analysis with the Plan Graph view in the SQL analyzer.
For detailed information about the SQL analyzer, refer to Analyzing Statement Performance in the SAP
HANA Administration Guide.
Related Information
Tables Used [page 262]
Analyzing Statement Performance
SAP Note 2565156
3.15.4Source Analysis
Before conducting a detailed technical analysis, it is recommended to rst analyze source artifacts (models,
scripts, views) for possible performance-impacting aspects.
Context
The actual activities depend on the respective artifact (models, scripts, views).
Procedure
1. Graphical Calculation Views
SAP Web IDE for SAP HANA oers dedicated performance debugging capabilities as part of the modeler
for graphical calculation views; furthermore it provides deeper inspection of these views.
a. Check the eect of the attributes, parameters and lters used in the query on the execution time.
b. Check that the information is combined and aggregated in the correct way as required by the business
scenario, for example:
• Is the aggregation behavior consistent with the intended semantics?
SAP HANA Troubleshooting and Performance Analysis Guide
Root Causes and Solutions
PUBLIC 201
• Is the join cardinality correct for each join?
• Are dynamic joins used?
• Is the result always aggregated?
• Has Join Optimization been enabled?
• Do analytical privileges inuence performance?
c. Check whether any performance-relevant execution hints are activated, for example:
• Enforce execution via a specied database engine
• Enforce upper bound for parallelization
d. Check whether modeling constructs are used that are known to be costly, for example:
• Calculated join attributes
• Complicated lter expressions
• Mixed models that involve engine switches
e. Check whether intermediate steps produce reasonable results (in terms of size).
2. SQL Script
The Statement Statistics view (part of the SQL analyzer) supports analysis of SQLScript.
a. Check if your procedure ts with the given guidelines
For example, see Developing Procedures
b. Analyze your script for most expensive steps / statements
3. Plain SQL
a. Check if your statement ts with the guidelines for SQL Query Design
For example, see Optimization of Critical SQL Statements
Results
As a result of this activity you either gured out and solved problems at the source level or you now have to
continue with an even deeper technical analysis.
Related Information
Developing Procedures [page 194]
Technical Analysis [page 203]
Statement Statistics [page 256]
Optimization of Critical SQL Statements [page 190]
202
PUBLIC
SAP HANA Troubleshooting and Performance Analysis Guide
Root Causes and Solutions

3.15.5Technical Analysis
The deepest level of performance analysis addresses the technical details of a database statement execution.
Context
You should follow this in order to track down problematic performance symptoms from which you can derive
possible root causes at higher levels.
There are a number of tools that can support you. SAP HANA cockpit oers the SQL analyzer which allows
for deep technical analysis. Dedicated views and lters support the analysis along numerous dimensions. For
detailed information about the SQL analyzer, refer to Analyzing Statement Performance in the SAP HANA
Administration Guide.
Procedure
1. Inspect aggregated execution KPIs (execution time, resource consumption, distribution characteristics) in
order to gure out in which aspect or dimension you might look for possible issues.
2. For any suspicious KPI, track down the KPI to the deepest possible level manifesting the symptom.
3. From there, try to correlate the symptom with the cause, in higher level statement elements.
4. You might restrict the scope of your analysis by focusing on the critical path, or on a specic time interval,
system node, engine, or execution plan operator.
Related Information
Analyzing SQL Execution with the Plan Explanation [page 248]
Analyzing Statement Performance
SAP Note 2565156
SAP HANA Troubleshooting and Performance Analysis Guide
Root Causes and Solutions
PUBLIC 203

3.16 System Hanging Situations
This section explains what checks to carry out and how to perform those checks if your SAP HANA instance is
hanging. The database is said to be hanging when it no longer responds to queries that are executed against it.
Context
The source of the system standstill might be related to any of the components involved, for example, the
storage, OS and hardware, network, SAP HANA database or the application layer. On servers with Intel
processors this situation may be caused by Transparent Huge Pages (THP).
For troubleshooting it is essential to collect information about the context of the active threads in the
SAP HANA database, therefore avoid restarting the database as retrospective analysis might not always be
possible. As SQL statements cannot usually be executed for analysis, you should perform the following steps if
it is still possible to log on to the OS of the master host (for example, as the <sid>adm user):
Procedure
1. Collect a runtime dump (see SAP Note 1813020 - How to generate a runtime dump on SAP HANA).
2. Collect CPU, memory and other information about threads currently running in the system by executing
the command top -H and taking a screenshot of the output.
3. Provide this information when logging an incident with SAP support.
Refer also to SAP Note 1999020 SAP HANA: Troubleshooting when database is no longer reachable for
further specic steps and guidance on proactive or reactive actions you can take.
Related Information
SAP Note 1999020
SAP Note 1813020
Transparent Huge Pages on Linux [page 204]
CPU Power Saving [page 206]
3.16.1Transparent Huge Pages on Linux
Transparent Huge Pages (THP) is a feature that is generally activated for the Linux kernel shipped with SUSE
Linux Enterprise Server (SLES) 11 and Red Hat Enterprise Linux (RHEL) 6 versions certied for usage with
SAP HANA. Due to the special manner of SAP HANA's memory management, using THP may lead to hanging
situations and performance degradation.
204
PUBLIC
SAP HANA Troubleshooting and Performance Analysis Guide
Root Causes and Solutions

Context
Note
Transparent Huge Pages is only relevant to servers with Intel processors.
You experience that your SAP HANA database does not react anymore, that the CPU load is high and/or severe
performance issues occur. Additionally, Transparent Huge Pages are activated on your SAP HANA servers.
SAP strongly recommends that you disable Transparent Huge Pages on all your SAP HANA servers. Alert 116 is
raised in the System database with a warning if Transparent Huge Pages are enabled.
See the SAP Notes below for further reference:
• SAP Note 2131662 - Transparent Huge Pages (THP) on SAP HANA Servers
• SAP Note 2031375 - SAP HANA: Transparent HugePages (THP) setting on Linux.
• SAP Note 1824819 - SAP HANA DB: Recommended OS settings for SLES 11 / SLES for SAP Applications 11
SP2
• SAP Note 1954788 - SAP HANA DB: Recommended OS settings for SLES 11 / SLES for SAP Applications 11
SP3
• SAP Note 2013638 - SAP HANA DB: Recommended OS settings for RHEL 6.5
• SAP Note 2136965 - SAP HANA DB: Recommended OS settings for RHEL 6.6
Note
The following checks and steps should be performed on all hosts of the aected SAP HANA system. They
have to be executed as the root user in the Linux shell.
Procedure
1. To check whether Transparent Huge Pages are activated execute the following command:
cat /sys/kernel/mm/transparent_hugepage/enabled
This returns a string showing which state is currently applied (the bracketed value is current): [always]
madvise never, '[always]' indicates that THPs are activated according to the value of the relevant Linux
kernel parameter.
Note that you can also do this in SQL by querying the view M_HOST_INFORMATION:
select * from M_HOST_INFORMATION where key =
'kernel.transparent_hugepage.enabled'
2. You can run the following command to conrm that processes are using THPs:
cat /proc/meminfo/ | grep AnonHugePages
This returns a kilobyte value showing memory usage by THP.
SAP HANA Troubleshooting and Performance Analysis Guide
Root Causes and Solutions
PUBLIC 205

3. Deactivate THP by executing the following command:
echo never > /sys/kernel/mm/transparent_hugepage/enabled
This will set the relevant kernel parameter to '[never]'; the command is immediately eective and should
resolve the hanging situation. You can rerun the command from the rst step to verify this action which
should now show: always madvise [never].
4. Note that the kernel parameter is only set/valid until the host is restarted the next time, the parameter
setting transparent_hugepage=never must therefore be persisted to prevent it toggling back to
'[always]' by using one of the following strategies:
a. Add the parameter setting to the kernel boot line in the /etc/grub.conf le of the bootloader.
b. Integrate the parameter setting within your system boot scripts such as: /etc/rc.local.
Related Information
SAP Note 2131662
SAP Note 2031375
SAP Note 1824819
SAP Note 1954788
SAP Note 2013638
SAP Note 2136965
3.16.2CPU Power Saving
The Linux Kernel shipped with SUSE Linux Enterprise Server (SLES) 11 and Red Hat Enterprise Linux (RHEL) 6
versions certied for usage with SAP HANA contain a new cpuidle driver for recent Intel CPUs. This driver leads
to a dierent behavior in C-states switching and causes performance degradations.
Context
See the SAP Notes below for further reference:
• SAP Note 1824819 SAP HANA DB: Recommended OS settings for SLES 11 / SLES for SAP Applications 11
SP2
• SAP Note 1954788 SAP HANA DB: Recommended OS settings for SLES 11 / SLES for SAP Applications 11
SP3
• SAP Note 2013638 SAP HANA DB: Recommended OS settings for RHEL 6.5
• SAP Note 2136965 SAP HANA DB: Recommended OS settings for RHEL 6.6
206
PUBLIC
SAP HANA Troubleshooting and Performance Analysis Guide
Root Causes and Solutions

Procedure
1. Check if the recommended driver is enabled and whether the CPU power safe mode is activated. Execute
the following command as root user in the Linux shell:
cat /sys/devices/system/cpu/cpuidle/current_driver
The correct value for the cpuidle driver should be "acpi_idle". If so, no further steps are required. In case
the output shows the wrong value "intel_idle", follow the steps in SAP Notes.
2. Check the CPU power save mode by running the following command:
cat /sys/devices/system/cpu/cpu*/cpufreq/scaling_governor
The correct value for the CPU power save mode should be "performance". If the output shows at least one
line with "ondemand", follow the steps in SAP Note 1890444 - Slow HANA system due to CPU power save
mode.
Related Information
SAP Note 1824819
SAP Note 1954788
SAP Note 2013638
SAP Note 2136965
SAP Note 1890444
3.17 Troubleshoot System Replication
This section describes how to analyze, avoid and solve problems related to system replication.
The following topics are covered:
• Performance: system replication appears to slow down transaction processing
• Setup and initial conguration problems
• Intermittent connectivity problems
• Managing the size of the log le with logreplay.
Further Resources
System Replication is described in detail in the SAP HANA Administration Guide and the SAP HANA System
Replication Guide. Additionally, the following set of documents including illustrated step-by-step procedures is
available on the SAP Community Portal:
• SAP HANA – High Availability ('White Paper')
SAP HANA Troubleshooting and Performance Analysis Guide
Root Causes and Solutions
PUBLIC 207

• SAP HANA – Host Auto-Failover
• How To Perform System Replication for SAP HANA 2.0
• SAP HANA Network Requirements
The two FAQ SAP Notes listed here relate to High Availability and Replication:
Related Information
SAP Note 2057595
SAP Note 1999880
SAP HANA Administration Guide
SAP HANA System Replication
3.17.1Replication Performance Problems
If system replication appears to slow down transaction processing, you can check the network and disk I/O on
the secondary site.
A slow-down related to system replication can occur in the following scenarios:
• ASYNC replication mode is congured over long distances;
• multi-tier system replication is congured and a tier 3 system is attached;
• SYNC/SYNCMEM replication mode is congured over short distances.
The following troubleshooting steps can help you determine and resolve the underlying cause.
Check If Log Can Be Shipped in Time
You can check the system replication KPI values to analyze the problem and verify that it is really related to
system replication:
• check if log shipping is signicantly slower than local log write (SYNC/SYNCMEM)
• check Async Buer Full Count (ASYNC)
You can check system replication KPIs in SAP HANA cockpit (see Monitoring SAP HANA System Replication
in the SAP HANA Administration Guide). You can also get an overview of basic system replication KPIs by
running the query HANA_Replication_SystemReplication_Overview_*_MDC.txt (from SAP Note 1969700 - SQL
Statement Collection for SAP HANA). This query is based on the system view M_SERVICE_REPLICATION and
208
PUBLIC
SAP HANA Troubleshooting and Performance Analysis Guide
Root Causes and Solutions

can be used to compare log shipping time to local log write time. For synchronous replication the following KPIs
are shown:
Example output of SQL Statement HANA_Replication_SystemReplication_Overview.txt
KEY VALUE
Replication mode SYNC
Secondary connect time 2016/10/18 14:02:36
Days since secondary connect time 1.26
Used persistence size (GB) 205.76
Log backup size / day (GB) 83.58
Local log buer write size (MB) 101130.54
Shipped log buer size (MB) 100258.52
Avg. local log buer write size (KB) 6.14
Avg. shipped log buer size (KB) 6.14
Avg. local log buer write time (ms) 0.13
Avg. log buer shipping time (ms) 0.24
Local log buer write throughput (MB/s) 44.68
Log buer shipping throughput (MB/s) 24.99
Initial data shipping size (MB) 0.00
Initial data shipping time (s) 0.00
Last delta data shipping size (MB) 2736.00
Last delta data shipping time (s) 13.00
Delta data shipping size (MB) 758704.00
Delta data shipping time (s) 3538.20
Delta data shipping throughput (MB/s) 214.43
Delta data shipping size / day (MB) n/a
Replication delay (s) 0.00
The following KPIs are of particular importance, the shipping time should not be signicantly higher than the
local write time:
• Avg. local log buer write time (ms)
SAP HANA Troubleshooting and Performance Analysis Guide
Root Causes and Solutions
PUBLIC 209
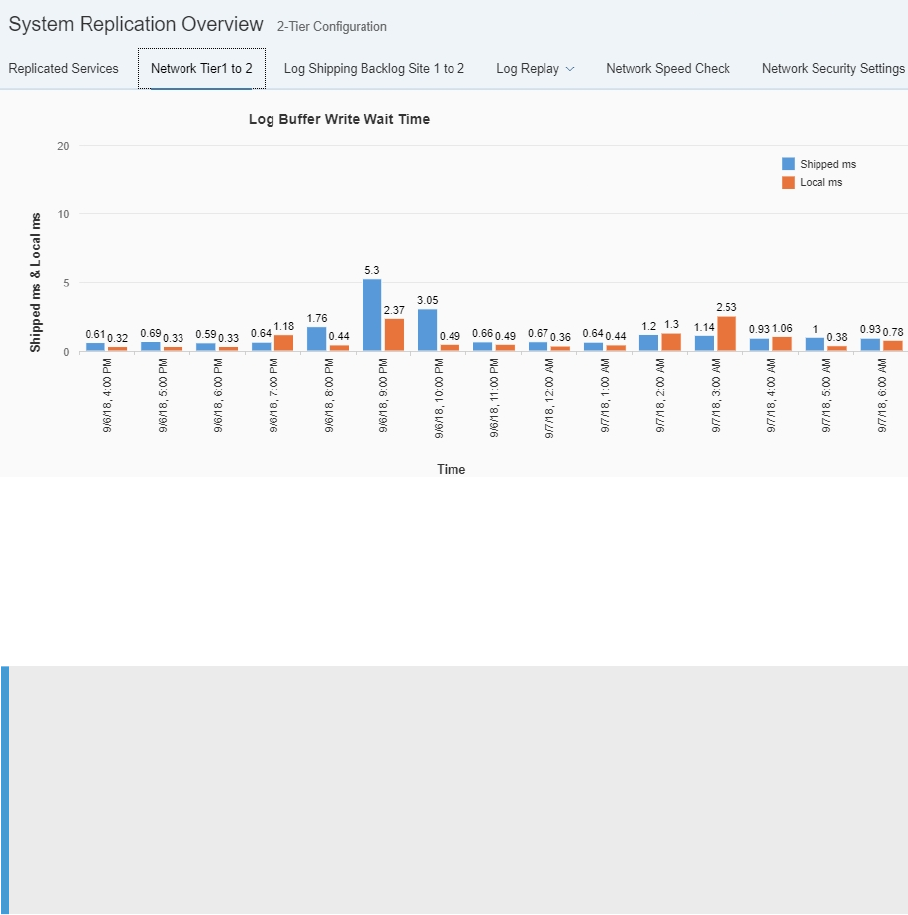
• Avg. log buer shipping time (ms)
You can see a graphical comparison of these local and shipped values in the cockpit System Replication
Overview (Network tab). The graph displayed compares the local write wait time with the remote write wait
time monitored over the last 24 hours:
For asynchronous replication scenarios the redo log is written into an Asynchronous Log Buer, which
occasionally can run full in case the logs are not shipped in a timely manner to the secondary
instance. This can lead to a performance overhead on the primary site as by default it waits with
new COMMITS until there is free space in the buer. This can be avoided by setting the parameter
logshipping_async_wait_on_buffer_full in the system_replication section of the global.ini le to
FALSE.
Note
In order to maintain a stable connection during the initial data shipment this parameter should be set to
true. This is recommended because if the log shipping connection is reset for any reason the data shipment
connection is also reset and the initial data shipment has to start again from the beginning. In multi-tier
scenarios a restarted full data shipment from primary to secondary site also results in a completely new
full data shipment to a tertiary site. For the duration of the initial shipment, therefore, you may also
increase the value of the logshipping_timeout parameter on the primary which has a default value of
30 seconds.
The size of the asynchronous log shipping buer on the primary site is normally adequate; the default value
of the logshipping_async_buffer_size parameter is 256MB for the indexserver (in the indexserver.ini)
and 64MB for all other services (maintained in the global.ini). However, if additional free memory is available
this value can also be increased for specic services with a high log generation (such as the indexserver). You
should make such changes only in the service-specic ini les rather than in the global.ini le.
Once the asynchronous replication connection is established you can see how much is in the async buer by
checking the value of BACKLOG_SIZE in the system view M_SERVICE_REPLICATION. If there is no connection
this column shows the number of log entries that have been generated on the primary but which have not yet
210
PUBLIC
SAP HANA Troubleshooting and Performance Analysis Guide
Root Causes and Solutions

reached the secondary. You can also see this information (the backlogSize) by running the following command
on the primary with admin rights:
hdbcons ‘replication info’
- backlogSize : 2781184 bytes
For further details of the most common performance issues caused by system replication and under which
circumstances they occur, please refer to SAP KBA 1999880 - FAQ: SAP HANA System Replication.
Check If Data Load Can Be Handled by Network Link
To estimate the required bandwidth for Data/Log shipping, use
HANA_Replication_SystemReplication_Bandwidth.txt (from SAP Note 1969700 - SQL Statement Collection for
SAP HANA), which is based on the I/O statistics from the primary site. We recommend executing this SQL
statement when system replication is disabled. The data returned will help you to estimate the amount of
data/log shipped from the primary site and compare this to the available bandwidth.
You can also do a network performance test using, for example, the open source IPERF tool or similar, to
measure the real application network performance. The recommended bandwidth is 10 Gbit/s.
If the network bandwidth is not adequate you can activate data and log compression which signicantly
reduces the shipment size by setting the following parameters in the system_replication section of
global.ini:
• enable_log_compression = TRUE
• enable_data_compression = TRUE
Check Network Conguration (Long Distance)
Increasing the TCP window size can result in better network utilization and higher throughput. If the bandwidth
can handle load, check if the network is shared and whether other applications may be interfering with
performance. Collect network information on bandwidth and latency from the Linux kernel parameters as
described here. For these values refer also to SAP Note 2382421 - Optimizing the Network Conguration on
HANA and OS-Level (Linux Kernel Parameters) :
• Check the network utilization prole for the network link to see if the maximum capacity of the network has
been reached.
• If the network is not fully utilized, check the linux kernel TCP conguration with sysctl –a | egrep
“net.core|net.ipv4.tcp” .
• Check that window scaling is set to the default value of 1. net.ipv4.tcp_window_scaling = 1.
• Check whether the max size can be increased for net.ipv4.tcp_wmem and net.ipv4.tcp_rmem.
• Calculate the Bandwidth Delay Product (BDP): Bandwidth * Latency (for example, BDP = 50ms * 3 Gbps =
19.2 MB). The BDP tells you what TCP window size is needed to use the network link fully.
SAP HANA Troubleshooting and Performance Analysis Guide
Root Causes and Solutions
PUBLIC 211

Check Disk I/O on a Secondary Site
Slow disk I/O on the secondary can postpone releasing log buers on the primary, which results in wait
situations on the primary. You can do the following:
• Use a Disk Performance Test Tool
Execute fsperf on log volume, for example:
$ fsperf /usr/sap/TST/SYS/global/hdb/log/mnt00001/hdb00002
• Check the Monitoring and Administration area
If SQL is not available, use command line tools (this has to be done for each individual service), for
example:
$ hdbcons "statreg print -n M_VOLUME_IO_TOTAL_STATISTICS -h"
A runtime dump also contains I/O statistics, which you can see with: $ hdbcons “runtimedump dump”.
Caution
Technical expertise is required to use hdbcons. To avoid incorrect usage, use hdbcons only with the
guidance of SAP HANA development support.
• Check I/O relevant tables in the proxy schema of the corresponding secondary site, which provide SQL
access on the primary site on statistic views of the secondary. For more information, see Monitoring
Secondary Sites in the SAP HANA Administration Guide.
Related Information
SAP Note 1969700
SAP Note 1999880
SAP Note 2382421
Monitoring Secondary Systems
Monitoring SAP HANA System Replication
3.17.2Setup and Initial Conguration Problems
This section outlines the analysis steps you need to take in case you face conguration problems during the
initial HANA System Replication Setup.
The initial SAP HANA System Replication Setup steps are as follows:
• enabling the SAP HANA System Replication on the primary site with sr_enable
• registering the secondary system with sr_register
While there are no errors to be expected when you enable the primary site, the registration operation on the
secondary site can fail due to various errors.
212
PUBLIC
SAP HANA Troubleshooting and Performance Analysis Guide
Root Causes and Solutions

Note
If you are in the process of setting up HANA System Replication for the rst time, please make sure you
have met all the prerequisites and performed the necessary preparation steps, outlined in the SAP HANA
Administration Guide.
Pay special attention to the following points:
• Are the primary and secondary sites architecturally identical?
• Are the network interface congurations identical on both sites? (refer to the SCN document SAP
HANA Network Requirements for details).
• Are the ports needed for system replication open and reachable from the primary and the secondary
site?
Wrong Topology Information
Upon registering the secondary site, the following error is raised:
Output Code
> hdbnsutil -sr_register
--remoteHost=primary_host --remoteInstance=<primary_instance_no> --
mode=<replication_mode>
--name=<logical_site_name>
adding site ...
checking for inactive nameserver ...
nameserver primary_host:3xx01 not responding.
collecting information ...
error: source system and target system have overlapping logical hostnames;
each site must have a unique set of logical hostnames.
hdbrename can be used to change names;
failed. trace file nameserver_primary_host.00000.000.trc may contain more
error details.
The root cause for those issues is usually a wrong topology information. In this case, the secondary site
contained the following landscape denition in the nameserver.ini:
Sample Code
[landscape]
id = <id>
master = <secondary_host>:3xx01
worker = <primary_host>
active_master = <secondary_host>:3xx01
roles_<primary_host> = worker
The worker property contained the hostname of the primary site, which was wrong. Therefore, the registration
failed. The problem should disappear once the correct hosts are maintained in the master and worker (if
any) properties. You need to check on both sites if the information maintained in the nameserver topology is
consistent.
SAP HANA Troubleshooting and Performance Analysis Guide
Root Causes and Solutions
PUBLIC 213

Resyncing the Secondary: Persistence Compatibility Checks
If the primary and secondary systems are disconnected for any reason, they must be resynced. If the
persistencies (that is, the data and log volume snapshots) of the primary and secondary are compatible, it
is possible to achieve a resync with only a delta data shipment or a log shipment; in this case full data shipping
is not necessary. Even if the data snapshots are not compatible, the system will automatically attempt a full
data shipment (Resync Optimization). If necessary, a full data shipment can be triggered manually using the
following command:
hdbnsutil -sr_register --force_full_replica
Trace messages related to persistence which indicate that this is necessary include the following:
• Secondary persistence is not compatible with primary persistence.
• The persistence of at least one service is not initialized correctly.
Communication Problems with the Primary Site
The sr_register command on the secondary site is failing with:
Output Code
> hdbnsutil -sr_register --name=<logical_site_name>
--remoteHost=<primary_host --remoteInstance=<primary_instance_no> --
mode=<replication_mode> --force_full_replica --sapcontrol=1
unable to contact primary site host <primary_host>:3xx02. connection
refused,location=<primary_host>:3xx02
Possible Root Cause 1: Ports Not Open / Blocked by Firewall
This error usually indicates a general communication problem between the primary and secondary site. Mostly,
this is caused by the primary host not listening on the required ports for various reasons. You can check
whether the required ports 3<instance_number>01 and 3<instance_number>02 (non-MDC scenarios)
or 4<instance_number>02 (MDC scenarios) are listening on the required interfaces with the following
command on OS level as privileged user (for example, root):
>netstat –apn | grep 3<instance_no>02
>netstat –apn | grep 4<instance_no>02
If you see that these ports are open and listening on the localhost interface only, you will not be able to reach
them from the secondary site. You need to adjust the settings for listeninterface in the global.ini le
from .local to .global:
Sample Code
[communication]
listeninterface=.global
214
PUBLIC
SAP HANA Troubleshooting and Performance Analysis Guide
Root Causes and Solutions
With this setting, the following interface:port pairs should be visible in netstat:
Note
If the ports are open, check whether they are not ltered by your rewall. Often it is not sucient to check
the connectivity to remote hosts via ping, because ping uses the ICMP protocol for communication. You
can easily verify the accessibility of remote hosts by issuing a telnet call. For example:
>telnet <primary_host> 30001
>telnet <primary_host> 30102
Possible Root Cause 2: SSL-Related Problems
Another cause for this error could be a wrongly implemented SSL conguration.
Note
If you do not secure the HANA network with SSL, do not implement any parameter changes related to SSL.
This can be revealed by activated corresponding traces on the primary site via SAP HANA cockpit:
• Database Explorer Trace Conguration Database Trace Search for “sr_nameserver” Change from
INFO to DEBUG
OK
• Database Explorer Trace Conguration Database Trace Search for “trexnet” Change from ERROR
to INFO
OK
Alternatively, the traces can be activated in the SQL console by issuing the following statements as a SYSTEM
user:
Source Code
alter system alter configuration ('indexserver.ini','SYSTEM') SET
('trace','sr_nameserver')='debug' with reconfigure;
alter system alter configuration ('indexserver.ini','SYSTEM') SET
('trace','trexnet')='info' with reconfigure;
After the trace activation, the registration problem needs to be reproduced by re-running the sr_register
command on the secondary. The nameserver trace on the primary site would reveal the following errors in the
CommonCrypto Engine:
Output Code
Crypto/SSL/CommonCrypto/Engine.cpp:563: SSL handshake failed: SSL error
[536871970]: Unknown error, General error: 0x20000422 | SAPCRYPTOLIB |
SSL_accept
SSL API error
Version in SSLPlaintext.version field of currently received record differs
from
the one negotiated in the current or currently accomplished handshake.
SAP HANA Troubleshooting and Performance Analysis Guide
Root Causes and Solutions
PUBLIC 215

0xa060023c | SSL | ssl3_accept
Version in SSLPlaintext.version field of currently received record differs
from
the one negotiated in the current or currently accomplished handshake.
0xa060023c | SSL | ssl3_get_record
Version in SSLPlaintext.version field of currently received record differs
from
the one negotiated in the current or currently accomplished handshake.
(ErrCode: 536871970)
Make sure the following parameters are consistent on both sites in the conguration le global.ini:
Sample Code
[communication]
ssl = systempki
..
...
[system_replication_communication]
enable_ssl = on
You need to ensure that the SSFS key and data les are stored on both sites. The following les must exist on
both sites:
$DIR_INSTANCE/../global/security/rsecssfs/data/SSFS_<SID>.DAT
$DIR_INSTANCE/../global/security/rsecssfs/data/SSFS_<SID>.KEY
Possible Root Cause 3: Wrong Conguration of the Internal Hostname Resolution
Parameters
Please check whether the internal hostname resolution information is consistent on both sites. The following
how-to guides are a good source of information:
• SAP HANA Network Requirements
• How to Perform System Replication for SAP HANA.
Possible Root-Cause 4: Wrong MTU Size Congured
A closer look at the nameserver trace le on the secondary site would reveal:
Output Code
error: unable to contact primary site; to
<primary_host_ip> (<primary_host>):3xx01; original error: timeout
occured,location=<primary_host_ip> :3xx02. Was MTU size set to 1500?
This problem is discussed in full detail in SAP Note 2166157 - Error: 'failed to open channel ! reason: connection
refused' when setting up Disaster Recovery. See also SAP Note 2142892 - SAP HANA System Replication
sr_register hangs at "collecting information"
Possible Root Cause 5: HANA Service Unavailability
Check the availability of the indexserver / nameserver process on the primary site. Often the services faced an
intermittent restart, crash or reconguration which did not go unrecognized by the secondary site.
216
PUBLIC
SAP HANA Troubleshooting and Performance Analysis Guide
Root Causes and Solutions

Related Information
SAP HANA Administration Guide
Congure Tracing in the SAP HANA Database Explorer
How to Perform System Replication for SAP HANA
SAP HANA Network Requirements
SAP Note 2166157
SAP Note 2142892
3.17.3Log Shipping Timeout
This section gives possible reasons why the log buer may not be shipped in a timely fashion from the primary
to the secondary site.
Possible Cause 1: Synchronous Replication Mode and Log Area Full on the Secondary Site
If the system replication mode is set to SYNC – full sync, the primary system waits before committing the
transaction until it gets a reply that the log is persisted on the secondary system. If the log volume is full on the
secondary then the commits on the primary are halted as logs can no longer be written on the secondary. On
the secondary site, the trace les contain the following error:
Output Code
i EventHandler LocalFileCallback.cpp(00455) : [DISKFULL] (1st request) [W] ,
buffer= 0x00007f7eef8ae000,
offset= 589299712, size= 0/524288, file= "<root>/logsegment_000_00000508.dat"
((open, mode= RW, access= rw-rw-r--, flags= DIRECT|LAZY_OPEN), factory=
(root= "/hana/log/<SID>/mnt00001/hdb00003/"
(access= rw-rw-r--, flags= AUTOCREATE_DIRECTORY, usage= LOG, fs= xfs,
config=
(async_write_submit_active=auto,async_write_submit_blocks=new,async_read_submi
t=off,num_submit_queues=1,
num_completion_queues=1,size_kernel_io_queue=512,max_parallel_io_requests=64,
min_submit_batch_size=16,max_submit_batch_size=64))) {shortRetries= 0,
fullRetries= 0 (0/10)}
To quickly mitigate the situation, you can disable the “full sync” option by running the following command:
>hdbnsutil -sr_fullsync --disable
Afterwards, the log area on the secondary site needs to be analyzed with regard to why the log segments are
not freed up. This is usually caused by an erroneous log backup mechanism.
For further details refer to the following SAP Notes:
SAP Note 2083715 - Analyzing log volume full situations
SAP Note 1679938 - Log Volume is full
Possible Cause 2: Intermittent Communication Issues on the Network Layer
Check the network communication channel between the primary and secondary site for issues that can block
log shipping for a signicant time.
SAP HANA Troubleshooting and Performance Analysis Guide
Root Causes and Solutions
PUBLIC 217
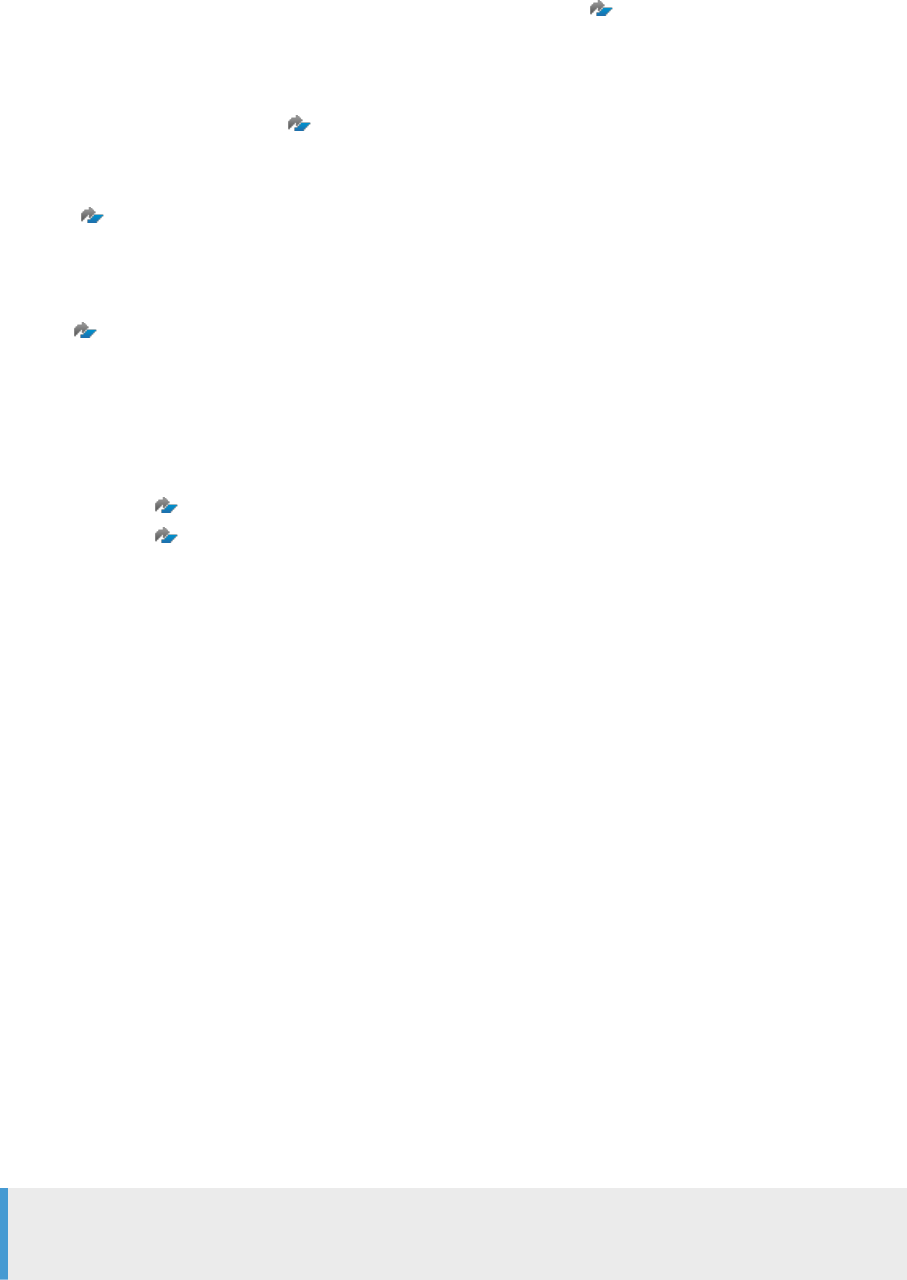
See the section in this guide SAP HANA System Replication Communication Problems for more information
about identifying problems on the network layer and SAP Note 2222200 FAQ: SAP HANA Network.
Possible Cause 3: Problems on the Secondary Site
Verify that the secondary site is online and runs stable. Check for service crashes or shutdowns that impact the
availability - see SAP Note 2177064 FAQ: SAP HANA Service Restarts and Crashes.
Check for performance issues on the secondary site, for example, the memory conguration may be too
small resulting in a high column unload / load rate or slow performance of the disk I/O stack. See SAP Note
2000000 FAQ: SAP HANA Performance Optimization.
Possible Cause 4: Problems on the Primary Site
A potential problem on the primary site is I/O issues accessing the shared le system. Refer to SAP Note
1999930
FAQ: SAP HANA I/O Analysis if you suspect that this may be the cause of the problem.
Related Information
SAP Note 2083715
SAP Note 1679938
SAP HANA System Replication Communication Problems [page 229]
3.17.4Troubleshooting Cluster Management Problems
This topic gives hints about how to approach troubleshooting replication issues when a third-party cluster
management solution is in use.
SAP Python API and Third Party Solutions
SAP provides a Python-based API which can be used to manage high availability and disaster recovery
processes, this can be adapted and integrated into your existing scripts. Calls to the API ("hooks" or HA/DR
providers) can be used for many operations that need to be executed, for example, to start tools and
applications on certain hosts after failover, or to stop DEV or QA SAP HANA instances on secondary sites
before takeover. For details of the scripts in the API and an example implementation please refer to section
'Implementing a HA/DR Provider' in the SAP HANA Administration Guide.
As an alternative to using the SAP API, cluster management solutions are also provided by third party suppliers
and partners. A list of certied HA-interface partners is available in an SAP Community wiki article: Certied
HA-Interface Partners.
Note
Support for partner solutions is provided by the supplier; SAP does not support third party solutions.
218
PUBLIC
SAP HANA Troubleshooting and Performance Analysis Guide
Root Causes and Solutions

The following SAP notes give more information about third-party cluster management solutions:
• SAP Note 1552925 - Linux: High Availability Cluster Solutions - general information about available
Linux suppliers.
• SAP Note 3007062 - FAQ list about Third Party Cluster Solutions.
• SAP Note 3288971 - FAQ SUSE HAE/RedHat HAA Pacemaker Cluster Resource Manager in SAP HANA
System Replication Environments.
Troubleshooting Connectivity Issues Related to Cluster and Pacemaker Tools
It may be dicult to diagnose the cause of issues when a third-party cluster management solution is in use. For
example, a situation may arise where a cluster tool unexpectedly triggers an auto takeover or system stop. You
analyze this event by looking at the var/log/messages of the host preceding the event and nd the following
message:
‘WARNING: HANA_CALL timed out after 60 seconds running command 'hdbnsutil
-sr_state'.
The cluster tool may be congured with thresholds that react to such a warning by automatically executing a
system stop and auto takeover and is therefore functioning as designed.
It is then necessary to analyze the cause of the timeout, which may be related to a problem with the SAP HANA
database. In this case, you can follow the troubleshooting procedures given in this guide.
Automatic Trigger of a Runtime Dump
An enhancement introduced in SAP HANA SPS 05 revision 057.00 automatically triggers a runtime dump if a
script takes longer than a given time. This feature is active by default and set to a delay value of 30 seconds.
You can change the delay time in the system database by changing the value (a number of seconds) of the
parameter automatic_rte_dump_delay (nameserver.ini -> [timeout] section). The dump is triggered if the
run time of any of the following scripts exceeds the congured delay value:
• landscapeHostConguration.py
• systemReplicationStatus.py
• getTakeoverRecommendation.py
• hdbnsutil -sr_state | -sr_stateConguration | -sr_stateHostMapping
If a dump is triggered it does not necessarily mean that there is a problem; it is triggered preemptively
to support troubleshooting in case there is a problem. The name of the trace le has the following
format: <service>_<host>.<port>.rtedump.<timestamp>.blocked_script.trc. See also question 4 in SAP Note
2400007 FAQ: SAP HANA Runtime Dumps.
Related Information
Implementing a HA/DR Provider (SAP HANA Administration Guide for SAP HANA Platform)
SAP HANA Troubleshooting and Performance Analysis Guide
Root Causes and Solutions
PUBLIC 219

Certied HA-Interface Partners (SAP Community Wiki Article)
SAP Note 2400007
3.17.5LogReplay: Managing the Size of the Log File
There is a risk in replication scenarios which use one of the logreplay operation modes of causing a disk full
situation on the primary if the secondary system is not available for any reason; this can potentially lead to a
complete freeze of the database.
The logreplay modes (logreplay introduced in HANA 1.0 SPS10 and logreplay_readaccess introduced in HANA
2) require a log history on the primary so that a secondary system can be resynchronized without the need
for a full data shipment. As long as a secondary system is registered the log le will continue to grow. When
the secondary system synchronizes, then the log is automatically cleared down. However, if the replication
environment changes, if for example, the secondary is separated because of network problems, manual
intervention may be required to manage the log le or, in the worst case scenario, to recover from a disk
full situation. This problem can also happen on a secondary system where a takeover has occurred.
The log replay modes are described in detail in the SAP HANA Administration Guide section System Replication
With Operation Mode Logreplay. This section of the SAP HANA Troubleshooting and Performance Analysis
Guide describes procedures to rstly prevent problems from occurring and secondly to resolve a disk full
situation.
Log File Retention (RetainedFree Status)
If the secondary cannot be synchronized for any reason, then log segments continue to be written but are
marked as RetainedFree. You can check for RetainedFree log segments either in SAP HANA cockpit or from the
command line.
220
PUBLIC
SAP HANA Troubleshooting and Performance Analysis Guide
Root Causes and Solutions
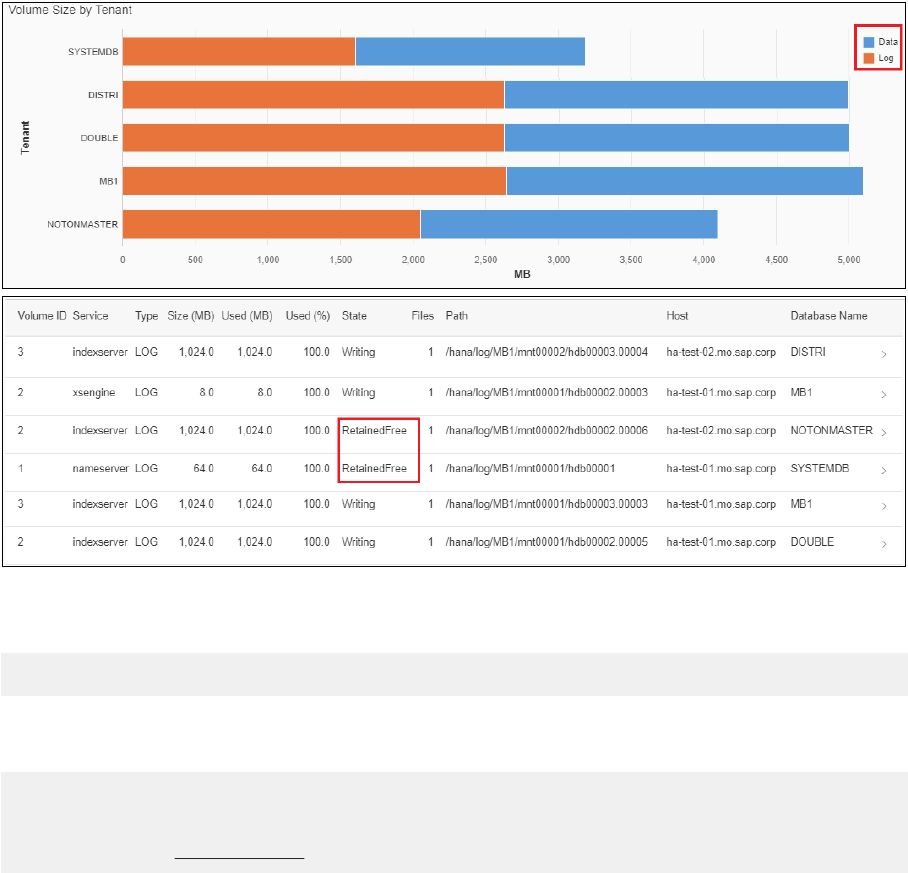
1) To check using SAP HANA cockpit, start from the Disk Usage app and open Monitor Disk Volume. The
graph shows usage for log and data volumes; you can lter the display for a specic volume and server (for
example indexserver). Check the State column of the log les for RetainedFree log segments as shown here:
2) To check using the command line, execute the following command as <sid>adm for a specic log volume
(hdb00003 in this example – the log volume of one indexserver):
#>hdblogdiag seglist $DIR_INSTANCE/../SYS/global/hdb/log/mnt00001/hdb00003
The result shows details of each log segment including status information. Look for any segments with status
RetainedFree as shown here:
LogSegment[0/2:0xec98740-0xecb6000(0x763000B)/
GUID=759DC14B-00D7-20161122-134436-39A00002ED/
PrevGUID=759DC14B-00D7-20161122-134436-39A00002EC,TS=2016-11-30 06:55:18.008741,
Hole=0xec98740/RetainedFree/0x0]@0x00007f34cb32a010
Maximum Number of Segments
A further possible cause of a log full event is if the maximum number of allocated log segments is reached.
By default, the maximum number is 10240 segments, if this limit is reached then log writing is blocked and
the system may hang as though the disk is full even though disk space is still available. You can change the
maximum number of log segments using the hdblogdiag tool as described in SAP Note 2072410 Enlarge
limitation of log segment number of LogSegment Directory.
SAP HANA Troubleshooting and Performance Analysis Guide
Root Causes and Solutions
PUBLIC 221

How to Avoid Log Full Situations
Unregister an Unused Secondary
If the secondary is disconnected for a prolonged period and if it is not to be used as a replication
server anymore, then unregister the secondary site and disable the primary functionality. This will stop the
RetainedFree log entries from being written:
1. Unregister the secondary; this is normally done from the secondary site but can be done from the primary
if the secondary is not available anymore:
hdbnsutil –sr_unregister
2. Disable the primary (from the primary site):
hdbnsutil –sr_disable
3. Execute recongure on the primary site:
hdbnsutil –reconfig
You can use this same procedure for a primary which, after a takeover, will no longer be used for failback.
Set a Maximum Retention Size
Another option to manage the log size is to set a value for the logshipping_max_retention_size
parameter. If the log size reaches this limit, then RetainedFree log entries will be overwritten. Note the following
points in this case:
• If any RetainedFree log entries are lost, then synchronization by logreplay will no longer be possible and a
full data shipment will be necessary to resynchronize the secondary.
• It is not possible to switch back to delta mode to resynchronize - only a full data shipping is possible.
Tip
As a further general precaution, to prevent any disk full situation from arising you can reserve a portion of
the disk with an emergency placeholder le (containing any dummy values), for example, occupying 5 – 10
% of the le system. This le can then be deleted if ever necessary to quickly solve disk full situations.
How to Recover From Log Full Situations
Secondary Has Been Taken out of Service
If the secondary has been permanently taken out of service, then these log entries will never be required. In this
case the secondary can be unregistered and the log volume cleaned up:
1. Unregister the secondary (same steps as previous subsection: unregister, disable and recongure).
2. Delete the Free marked log segments from the command line for each of the persistent relevant services
(nameserver, indexserver, xsengine, …). To do this run hdbcons with the log release parameter as
<sid>adm. In a multi-database system the -p switch is required with the process ID of the service (such as
indexserver):
hdbcons –p <PID_of_service> “log release”
222
PUBLIC
SAP HANA Troubleshooting and Performance Analysis Guide
Root Causes and Solutions

Secondary Still Required
If the secondary is still required, then restart it and allow it to resynchronize. When this has completed, the
RetainedFree log segments on the primary will be marked as Free, you can then clean up the log as described
above by running hdbcons with the log release parameter.
Log Full Has Caused Complete Database Freeze
If the log full has caused a complete database freeze, you can try to move the log to another linked le system
and replay the log from there. Essentially, this is a three step procedure, refer to SAP Note 1679938 Log Volume
is full for complete details:
• Stop the primary system.
• Mount the log volumes of the primary via symbolic link to another le system.
• Start the primary and the secondary and allow them to resynchronize.
When this has completed, you can then clean up the log by running hdbcons with the log release parameter
as described above.
Related Information
SAP Note 1679938
SAP Note 2072410
3.18 Network Performance and Connectivity Problems
This section covers the troubleshooting of problems on the network layer.
In cases where a subjectively slow performing system behaviour is experienced, but a rst analysis of the SAP
HANA resource utilization does not reveal any obvious culprits, it is often necessary to analyze the network
performance between the SAP HANA server host(s) and SAP Application Server(s) / Non-ABAP clients, SAP
HANA nodes (inter-node communication in SAP HANA scale-out environments), or, in an SAP HANA system
replication scenario, between primary and secondary site.
3.18.1Network Performance Analysis on Transactional Level
The following section should help you to perform an in-depth investigation on the network performance of
specic clients.
Prerequisites
SYSTEM administrator access using SAP HANA cockpit or hdbsql.
SAP HANA Troubleshooting and Performance Analysis Guide
Root Causes and Solutions
PUBLIC 223
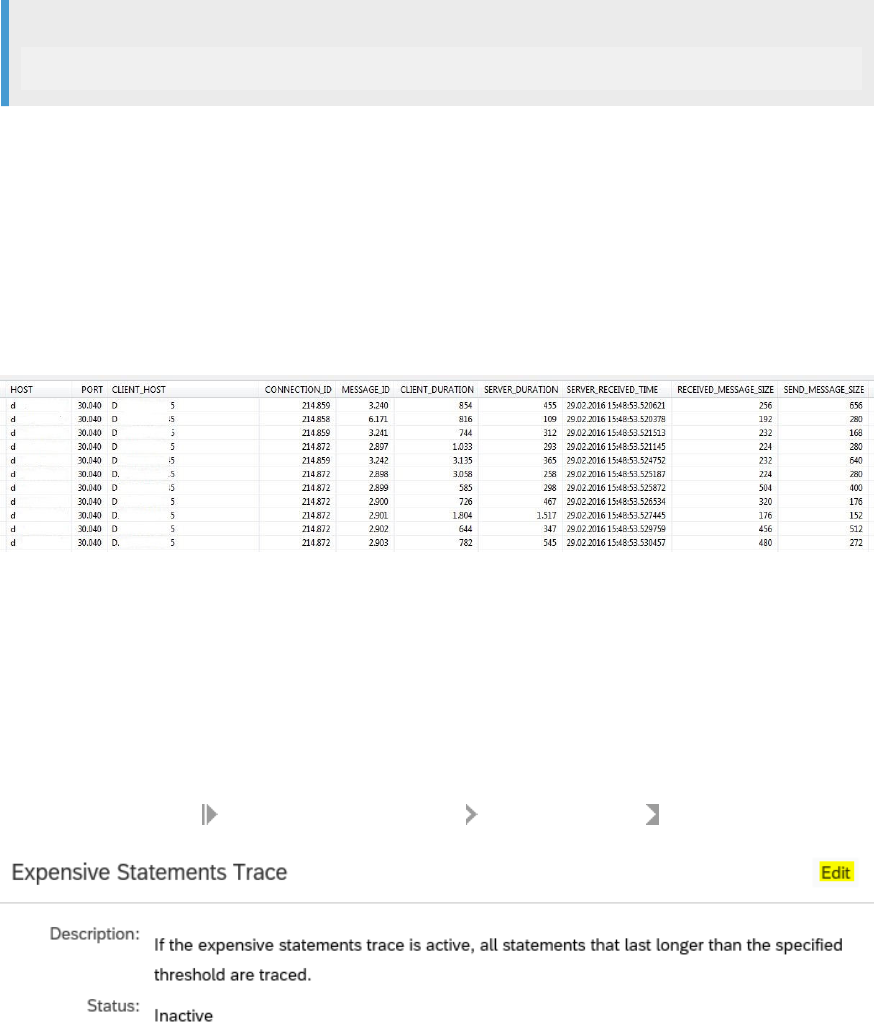
Procedure
1. Use the monitoring view M_SQL_CLIENT_NETWORK_IO to analyse gures about client and server elapsed
time as well as message sizes for client network messages.
Sample Code
SELECT * FROM M_SQL_CLIENT_NETWORK_IO
In case a long execution runtime is observed on the application server side and the corresponding
connections on the SAP HANA side do not show expensive operations, an overview of the total processing
time spent on client side and SAP HANA server side can be retrieved by executing the above SQL query.
By default, collection of statistics related to client network I/O is regulated by the following parameter
sql_client_network_io in the indexserver.ini le, which must be set to on (true).
Please note that this parameter change implies a certain performance overhead and should only be active
for the duration of the troubleshooting activity.
An example result of the above mentioned query is shown here:
CLIENT_DURATION and SERVER_DURATION contain the values in microseconds. The dierence
between CLIENT_DURATION and SERVER_DURATION makes the total transfer time of the result
(SEND_MESSAGE_SIZE in bytes). This allows you to see whether the transfer time from the SAP HANA
server to the client host is exceptionally high.
2. Run SQL: “HANA_Network_Clients” from the SQL statement collection attached to SAP Note 1969700.
Another important KPI is the Round Trip Time (RTT) from server to client. In order to analyze this gure the
SQL statement "HANA_Network_Clients" from the collection attached to SAP Note 1969700 can be used.
As this SQL statement is using the view M_EXPENSIVE_STATEMENTS, the expensive statements trace
needs to be active in the SAP HANA database explorer Trace Conguration :
224
PUBLIC
SAP HANA Troubleshooting and Performance Analysis Guide
Root Causes and Solutions
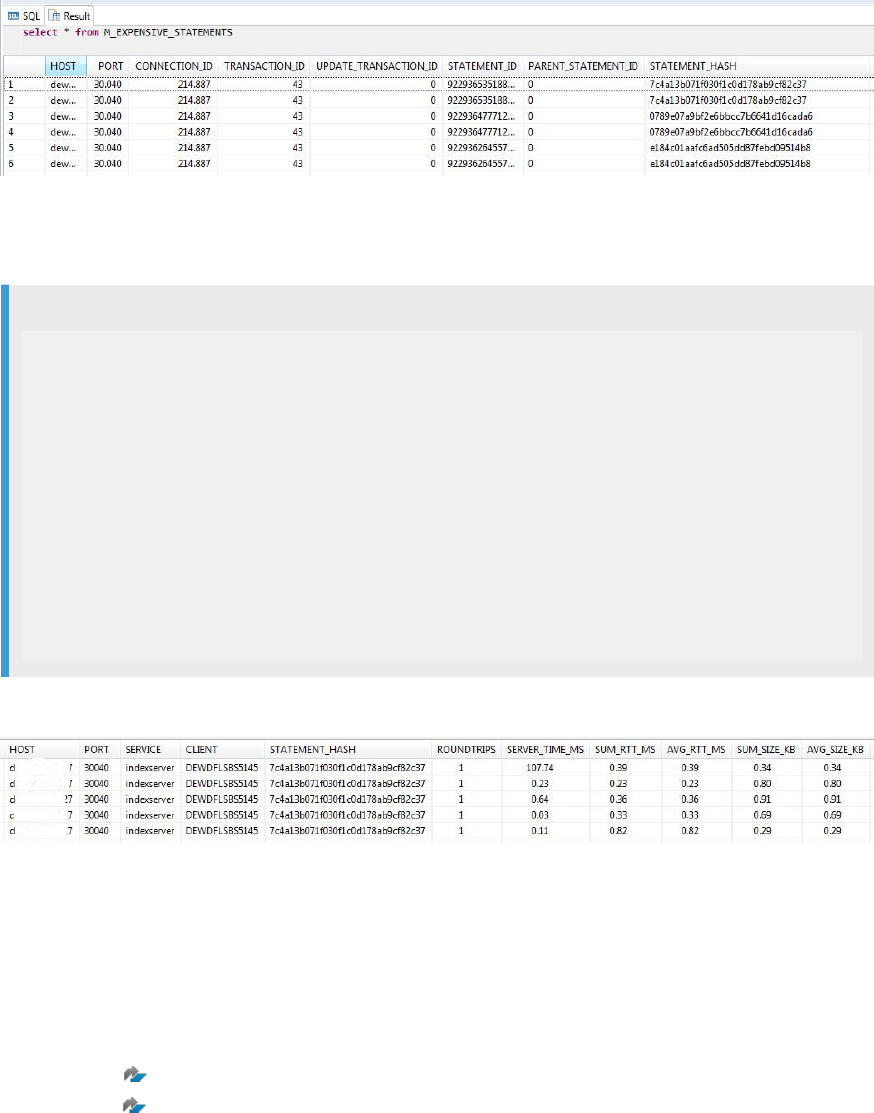
Once the trace is activated and the long-running statements are re-executed, the information to be
extracted from the M_EXPENSIVE_STATEMENTS view is STATEMENT_HASH:
With the Statement Hash '7c4a13b071f030f1c0d178ab9cf82c37' (please note that this one is only an
example statement hash) of the SQL statement to be analyzed, the SQL “HANA_Network_Clients” can be
modied in a way that a corresponding Statement Hash is used to restrict the selection:
Sample Code
…
SELECT /* Modification section */
TO_TIMESTAMP('1000/01/01 18:00:00', 'YYYY/MM/DD HH24:MI:SS')
BEGIN_TIME,
TO_TIMESTAMP('9999/12/31 18:10:00', 'YYYY/MM/DD HH24:MI:SS')
END_TIME,
'%' HOST,
'%' PORT,
'%' SERVICE_NAME,
'%' CLIENT_HOST,
'7c4a13b071f030f1c0d178ab9cf82c37' STATEMENT_HASH,
.
.
.*/
FROM
DUMMY
Which provides the following result:
The KPI AVG_RTT_MS is of importance and should not show values signicantly higher than ~ 1,5 ms.
3. For further options, please refer to SAP KBA 2081065.
Related Information
SAP Note 2081065
SAP Note 1969700
SAP HANA Troubleshooting and Performance Analysis Guide
Root Causes and Solutions
PUBLIC 225

3.18.2Stress Test with NIPING
The SAP NIPING tool is a powerful tool which can be used to perform specic network stability tests.
Prerequisites
You must have OS level access to the SAP HANA host and the client host.
Procedure
Read SAP Note 500235 - Network Diagnosis with NIPING.
A stress test with SAP's NIPING tool may be performed in order to conrm the high network latency (or
bandwidth exhaustion).
Related Information
SAP Note 500235
3.18.3Application and Database Connectivity Analysis
There are a number of ways to identify possible root causes for network communication issues between your
application and the SAP HANA instance it is connecting to.
Prerequisites
You have access to both the application and SAP HANA instance.
Procedure
1. On an ABAP application server, check the following:
a. Run transaction OS01 - Database - Ping x10
If a connection to the database cannot be established over a longer period of time by an SAP ABAP
application work process, the work process is terminated. First, the work process enters the reconnect
226
PUBLIC
SAP HANA Troubleshooting and Performance Analysis Guide
Root Causes and Solutions

state in which it constantly tries to connect to the database, after a predened amount of retries fail,
the work process terminates. In this case the connectivity from the SAP application server to the SAP
HANA server must be veried.
b. Run transaction SE38 - Report ADBC_TEST_CONNECTION
If a specic database connection is failing, the report ADBC_TEST_CONNECTION oers a connectivity
check for each dened database connection.
c. Check for common errors in SAP KBA 2213725 - How-To: Troubleshooting of -10709 errors
If an application is facing communication issues with the SAP HANA server, on client side the
connectivity issue may be indicated by several 10709-errors, mostly short dumps. The error 10709
is generic but the error text of the short dumps contains the error information that was returned by the
server. Some root causes may be found in unfavorable parameter settings, either on client or on server
side, some may be caused by a faulty network.
In most cases, a short dump with characteristics is raised:
Sample Code
Category Installation Errors
Runtime Errors DBSQL_SQL_ERROR
Except. CX_SY_OPEN_SQL_DB
The "Database error text" gives you a rst hint as to what might have caused the issue. For an overview
of the most common errors in this context and detailed explanations of how to resolve them, see SAP
KBA 2213725 - How-To: Troubleshooting of -10709 errors.
2. On non-ABAP applications, check the following SAP Notes and documentation references:
a. SAP Note 1577128 - Supported clients for SAP HANA
On non-ABAP client connections check that the client you are using is supported.
b. Section Troubleshooting: ODBC Tracing in the SAP HANA Client Interface Programming Reference
A typical SAP HANA ODBC connection failure is indicated by an error with the following prex:
Sample Code
[LIBODBCHDB SO][HDBODBC]....
The most common errors are documented in SAP Notes and KBAs. You can use the search features
of the Support portal to nd a solution for a specic error. If no specic SAP Note is available, you can
record an ODBC trace to gain more detailed insight.
c. SAP KBA 2081065 - Troubleshooting SAP HANA Network
If the error occurs sporadically, it is useful to perform a long-term stress test between the client and
SAP HANA server to conrm the network's stability. For more information, see SAP Note 500235. To
examine the exact trac from the TCP/IP layer, a tcpdump can be recorded which shows what packets
are sent and received and which packets were rejected or required a retransmission.
3. Generic Smart Data Access troubleshooting steps are:
a. To verify that the issue might not be a aw in the SAP HANA cockpit, always try to connect via the 'isql'
tool on the SAP HANA host directly as the SAP HANA<sid>adm.
b. Make sure all libraries can be accessed on OS level by the SAP HANA <sid>adm user (PATH
environment variable).
SAP HANA Troubleshooting and Performance Analysis Guide
Root Causes and Solutions
PUBLIC 227

c. In the SAP HANA <sid>adm home directory (cd $home) check that the correct host and port, and
username and password combinations are used in the .odbc.ini le.
d. Check that the LD_LIBRARY_PATH environment variable of the SAP HANA <sid>adm user contains
the unixODBC and remote DB driver libraries.
For example, with a Teradata setup, the LD_LIBRARY_PATH should contain the following
paths: .../usr/local/unixODBC/lib/:/opt/teradata/client/15.00/odbc_64/lib...
Connections from the SAP HANA server to remote sources are established using the ODBC interface
(unixODBC). For more information, see the SAP HANA Administration Guide.
4. Microsoft SQL Server 2012 - Specic Smart Data Access Troubleshooting
a. Make sure unixODBC 2.3.0 is used. A higher version leads to a failed installation of the Microsoft ODBC
Driver 11 for SQL Server 2012.
b. The version can be veried with the following command executed as the SAP HANA <sid>adm user
on the SAP HANA host: isql --version.
c. You can also refer to the Guided Answers tree Troubleshooting Smart Data Access (SDA) Conguration.
5. Teradata - Specic Smart Data Access Troubleshooting
a. Check SAP KBA 2078138 - "Data source name not found, and no default driver specied" when
accessing a Teradata Remote Source through HANA Smart Data Access.
Under certain circumstances it is necessary to adjust the order of the paths maintained in
LD_LIBRARY_PATH.
Related Information
SAP Note 2213725
SAP Note 1577128
SAP Note 2081065
SAP Note 500235
SAP Note 2078138
SAP HANA Administration Guide
Client Interface Programming Reference: ODBC Tracing and Trace Options
Troubleshooting Smart Data Access (SDA) Conguration (Guided Answer)
228
PUBLIC
SAP HANA Troubleshooting and Performance Analysis Guide
Root Causes and Solutions

3.18.4SAP HANA System Replication Communication
Problems
Problems during initial setup of the system replication can be caused by incorrect conguration, incorrect
hostname resolution or wrong denition of the network to be used for the communication between the
replication sites.
Context
System replication environments depend on network bandwidth and stability. In case communication
problems occur between the replication sites (for example, between SITE A and SITE B), the rst indication of a
faulty system replication setup will arise.
Procedure
1. Check the nameserver traceles.
The starting point for the troubleshooting activity are the nameserver traceles. The most common errors
found are:
Sample Code
e TNS TNSClient.cpp(00800) : sendRequest dr_secondaryactivestatus
to <hostname>:<system_replication_port> failed with NetException.
data=(S)host=<hostname>|service=<service_name>|(I)drsender=2|
e sr_nameserver TNSClient.cpp(06787) : error when sending request
'dr_secondaryactivestatus' to <hostname>:<system_replication_port>:
connection broken,location=<hostname>:<system_replication_port>
e TrexNetBuffer BufferedIO.cpp(01151) : erroneous channel ### from
##### to <hostname>:<system_replication_port>: read from channel failed;
resetting buffer
Further errors received from the remote side:
Sample Code
Generic stream error: getsockopt, Event=EPOLLERR - , rc=104: Connection
reset by peer
Generic stream error: getsockopt, Event=EPOLLERR - , rc=110: Connection
timed out
It is important to understand that if those errors suddenly occur in a working system replication
environment, they are often indicators of problems on the network layer. From an SAP HANA perspective,
there is nothing that could be toggled, as it requires further analysis by a network expert. The investigation,
in this case, needs to focus on the TCP trac by recording a tcpdump in order to get a rough
understanding how TCP retransmissions, out-of-order packets or lost packets are contributing to the
overall network trac. How a tcpdump is recorded is described in SAP Note 1227116 - Creating network
SAP HANA Troubleshooting and Performance Analysis Guide
Root Causes and Solutions
PUBLIC 229

traces. As these errors are not generated by the SAP HANA server, please consider consulting your
in-house network experts or your hardware vendor before engaging with SAP Product Support.
2. Set the parameter sr_dataaccess to debug.
In the DB Administration area of the SAP HANA cockpit open the Conguration of System Properties
monitor. In the [trace] section of the indexserver.ini le set the parameter sr_dataaccess = debug.
This parameter enables a more detailed trace of the components involved in the system replication
mechanisms. For more information about how to change parameters, see Memory Information from Logs
and Traces.
Related Information
SAP Note 1227116
Memory Information from Logs and Traces [page 66]
3.18.5SAP HANA Inter-Node Communication Problems
This section contains analysis steps that can be performed to resolve SAP HANA inter-node communication
issues.
Procedure
1. If communication issues occur between dierent nodes within an SAP HANA scale-out environment,
usually the SAP HANA traceles contain corresponding errors.
A typical error recorded would be:
Sample Code
e TrexNet Channel.cpp(00343) : ERROR: reading from channel ####
<IP_of_remote_host:3xx03> failed with timeout error; timeout=60000 ms
elapsed
e TrexNetBuffer BufferedIO.cpp(01092) : channel #### from : read from
channel failed; resetting buffer
To understand those errors it is necessary to understand which communication parties are aected by this
issue. The <IP:port> information from the above mentioned error already contains valuable information.
The following shows the port numbers and the corresponding services which are listening on those ports:
Sample Code
Nameserver 3<instance_no>01
Preprocessor 3<instance_no>02
Indexserver 3<instance_no>03
Webdispatcher 3<instance_no>06
XS Engine 3<instance_no>07
230
PUBLIC
SAP HANA Troubleshooting and Performance Analysis Guide
Root Causes and Solutions

Compileserver 3<instance_no>10
Interpreting the above error message it is safe to assume that the aected service was failing to
communicate with the indexserver of one node in the scale-out system. Please note that these errors
are usually caused by network problems and should be analyzed by the person responsible for OS or
network or the network team of the hardware vendor.
2. In SAP HANA cockpit go to the Threads tile and check the column Thread Status for Network Poll, Network
Read, Network Write.
In case the Threads tile in the SAP HANA cockpit shows many threads with the state Network Poll, Network
Read or Network Write, this is a rst indication that the communication (Network I/O) between the SAP
HANA services or nodes is not performing well and a more detailed analysis of the possible root causes
is necessary. For more information about SAP HANA threads, see SAP KBA 2114710 - FAQ: SAP HANA
Threads and Thread Samples.
3. Run SQL: "HANA_Network_Statistics".
As of SAP HANA SPS 10 the view M_HOST_NETWORK_STATISTICS provides SAP HANA host related
network gures. The SAP HANA SQL statement collection from SAP Note 1969700 - SQL Statement
Collection for SAP HANA contains SQL: “HANA_Network_Statistics” which can be used to analyze the
network trac between all nodes within a SAP HANA scale-out system.
Sample Code
---------------------------------------------------------------------------
----------
|HOST |SEG_RECEIVED |BAD_SEG_RCV|BAD_SEG_PCT|SEG_SENT |SEG_RETRANS|
RETRANS_PCT|
---------------------------------------------------------------------------
----------
|hostnam| 163965201| 282| 0.00017| 340922924|
19520| 0.00572|
---------------------------------------------------------------------------
----------
For a detailed documentation of the gures from this output, please refer to the documentation section of
the SQL statement SQL: “HANA_Network_Statistics”.
4. Run SAP HANA Conguration Mini Checks from SAP KBA 1999993 - How-To: Interpreting SAP HANA Mini
Check Results.
The "Network" section of the mini-check results contains the following checks:
Sample Code
---------------------------------------------------------------------------
-------------------
|CHID |DESCRIPTION |HOST |VALUE |
EXPECTED_VALUE|C|SAP_NOTE|
---------------------------------------------------------------------------
-------------------
|**** |NETWORK | |
| | | |
| | | |
| | | |
| 1510|Avg. intra node send throughput (MB/s) |hostnam|444 |>=
120 | | 2222200|
| 1512|Avg. inter node send throughput (MB/s) |hostnam|never |>=
80 | | 2222200|
SAP HANA Troubleshooting and Performance Analysis Guide
Root Causes and Solutions
PUBLIC 231
| 1520|Retransmitted TCP segments (%) | |0.00571 |<=
0.10000 | | 2222200|
| 1522|Bad TCP segments (%) | |0.00017 |<=
0.01000 | | 2222200|
---------------------------------------------------------------------------
-------------------
The results usually contain an "expected value" (which provides a certain "rule of thumb" value) and a
"value" eld which represents the actual value recorded on the system. If the recorded value is breaching
the limitations dened by the expected value, the "C" column should be agged with an 'X'. You can then
check the note for this item referenced in the column SAP_NOTE.
Related Information
SAP Note 2114710
SAP Note 1969700
SAP Note 1999993
3.19 SAP HANA Dynamic Tiering
Identify and resolve specic performance issues and enhance the performance of SAP HANA dynamic tiering.
Note
Troubleshooting information for SAP HANA dynamic tiering is in the SAP HANA Dynamic Tiering:
Administration Guide.
3.19.1Tools and Tracing
This section gives you an overview of the tools and tracing options available for SAP HANA dynamic tiering.
3.19.1.1Federation Trace
Federation trace can be turned ON to diagnose most issues with SAP HANA dynamic tiering.
Federation trace generates tracing information in the indexserver.ini trace le.
To enable federation trace:
ALTER SYSTEM ALTER CONFIGURATION ('indexserver.ini', 'SYSTEM') SET ('trace',
'fedtrace') = 'debug' WITH RECONFIGURE;
232
PUBLIC
SAP HANA Troubleshooting and Performance Analysis Guide
Root Causes and Solutions

ALTER SYSTEM ALTER CONFIGURATION ('indexserver.ini', 'SYSTEM') SET ('trace',
'federationexecution') = 'debug' WITH RECONFIGURE;
3.19.2Query Plan Analysis
The query plan shows the various operators involved in the query execution.
Queries referencing both SAP HANA tables and SAP HANA dynamic tiering tables are either:
• Executed in SAP HANA by pulling data from SAP HANA dynamic tiering
• Relocated to SAP HANA dynamic tiering, where the data is pulled from SAP HANA
Generally, since SAP HANA dynamic tiering involves tables with large amounts of data, it may be preferable to
use the latter strategy. Another reason to use the latter strategy is when the SAP HANA dynamic tiering table is
too large to t in SAP HANA.
If your query involves both SAP HANA tables and SAP HANA dynamic tiering tables and you are experiencing
poor performance, you should review the query plan. Review the visual query plan that shows the timings
for various sub-trees. Alternatively, you can query M_REMOTE_STATEMENTS to show timing results for query
fragments executed on SAP HANA dynamic tiering. If the timing shown is small, and you think the optimizer is
shipping the upper limit of query fragments, then SAP HANA dynamic tiering is probably not the cause of the
performance problem.
The Remote Row Scan operator deals with a query fragment executed by an SAP HANA dynamic tiering
node. If this operator is directly under the top-level Project node, then the entire query has been either
pushed down or relocated to an SAP HANA dynamic tiering node. Generally, relocating the query yields better
performance.
Changing the Execution Strategy to Remote
If the execution strategy 'auto' mode is not yielding the best plan, try the following procedure to change the
execution strategy from 'auto' to 'remote':
1. Clear the query plan cache.
ALTER SYSTEM CLEAR SQL PLAN CACHE;
2. Change the execution strategy from 'auto' to 'remote':
ALTER SYSTEM ALTER CONFIGURATION ('esserver.ini', 'SYSTEM') SET
('row_engine', 'execution_strategies') = 'remote' WITH RECONFIGURE;
Changing the Execution Strategy to Auto
If the execution strategy is set to 'auto', then the optimizer chooses the best strategy for executing the query:
either relocating the query to SAP HANA dynamic tiering, or executing the query in SAP HANA. In most cases,
'auto' provides best performance.
SAP HANA Troubleshooting and Performance Analysis Guide
Root Causes and Solutions
PUBLIC 233

1. Change the execution strategy from 'remote' to 'auto':
ALTER SYSTEM ALTER CONFIGURATION ('esserver.ini', 'SYSTEM') SET
('row_engine', 'execution_strategies') = 'auto' WITH RECONFIGURE;
If neither execution strategy improves performance, there may be a capability issue. The query optimizer
decides what to push down to SAP HANA dynamic tiering based on the capability supported by the option. If
the query deals with some operator, builtin, or other item that SAP HANA dynamic tiering does not understand,
then it lets the SAP HANA execution engine compensate for it. Review your query to see if there are any
unsupported operators, or builtins and see if you can rewrite the query without them. Finally, you may be
missing statistics on the tables that may prevent the optimizer from choosing an optimal query plan.
3.19.2.1Statistics
Statistics help the query optimizer in choosing the right query plan. Missing statistics may prevent the query
optimizer from selecting the optimal query plan.
When no statistics for an extended table are present, the query optimizer assumes the table size to be 1 million
rows. If the actual table has signicantly dierent number of rows, then the query plan chosen may not be
optimal. To ensure that optimizer has the correct information, we recommend that you create statistics on the
extended tables.
SAP HANA currently supports several types of statistics:
HISTOGRAM
Creates a data statistics object that helps the query optimizer estimate the data distribution
in a single-column data source. If you specify multiple columns in <data_sources>, then
multiple data statistics objects (HISTOGRAM) are created--one per column specied.
SIMPLE
Creates a data statistics object that helps the query optimizer calculate basic statistics,
such as min, max, null count, count, and distinct count for a single-column data source. If
you specify multiple columns in <data_sources>, then multiple data statistics objects are
created--one per column specied.
TOPK
Creates a data statistics object that helps the query optimizer identify the highest-frequency
values in a table data source. If you specify multiple columns in <data_sources>, then
multiple data statistics objects are created--one per column specied.
SKETCH
Creates a data statistics object that helps the query optimizer estimate the number of
distinct values in the data source. A data statistics object is created for the specied
<table_name>(<column-name>,...), which approximates the number of distinct tuples
in the projection of the table on the set of specied columns.
SAMPLE
Creates a sample of data from <data_source> that the SQL optimizer can use during
optimization. When benecial, the SQL optimizer generates system SAMPLE data statistics
objects automatically on column and row store tables. However, this behavior can incur a
cost to performance. You can avoid this cost by creating SAMPLE data statistics objects
explicitly (in advance). Creating them explicitly is especially useful in situations where
sampling live table data is expensive (for example, very large tables).
234 PUBLIC
SAP HANA Troubleshooting and Performance Analysis Guide
Root Causes and Solutions
RECORD
COUNT
Creates a data statistics object that helps the query optimizer calculate the number of
records (rows) in a table data source. The RECORD COUNT type is a table-wide statistic. You
do not specify columns in <data_sources> when creating a RECORD COUNT data statistics
object. When benecial, the SQL optimizer maintains system RECORD COUNT data statistics
objects automatically on column and row store tables.
We recommend that simple statistics, at the very least, are present on key columns of extended tables.
3.19.3Data Loading Performance
SAP HANA dynamic tiering supports all data loading methods for extended tables. This section explores
the various mechanisms for inserting data into extended tables, and recommends the optimal loading
mechanisms.
In general, SAP HANA dynamic tiering is optimized for batch writes, like SAP HANA. Singleton writes are not
the best use case for SAP HANA dynamic tiering, although singleton writes are supported.
3.19.3.1IMPORT FROM Statement
If you have a CSV le for the data to be loaded, the IMPORT FROM statement is by far the best method for
loading data into an SAP HANA dynamic tiering table.
The IMPORT FROM statement is sent directly to the SAP HANA dynamic tiering node for the data load.
Currently, IMPORT FROM does not support the THREADS parameter on the import command and hence it is
better to break the les into multiple les if you are planning on loading hundreds of millions of rows.
When dealing with a delta-enabled extended table, you can run these IMPORT FROM statements in parallel
if required. However, note that this will put heavy demand on the delta memory. Make sure delta memory is
appropriately congured. Alternatively, you can do this load serially.
When importing very large amounts of data into an extended table, use multiple les in the same IMPORT
FROM statement. Breaking into multiple les for IMPORT FROM yields better performance than a single le
import.
3.19.3.2INSERT Statement with SELECT Statement
If the data is present in another SAP HANA table, then INSERT-SELECT is a better loading method than the
IMPORT FROM statement.
The query optimizer tries to relocate the INSERT-SELECT on an extended table to the SAP HANA dynamic
tiering node. The SAP HANA dynamic tiering node does a parallel fetch from SAP HANA, thereby speeding up
the INSERT-SELECT.
SAP HANA Troubleshooting and Performance Analysis Guide
Root Causes and Solutions
PUBLIC 235

3.19.3.3Parameterized Array Inserts
Array insert is by far the most optimal mechanism to load data into an extended table.
SAP HANA dynamic tiering converts an array-insert into a LOAD statement on the SAP HANA dynamic tiering
node.
Bulk load is controlled by the bulk_inserts_as_load and bulk_load_as_binary parameters. Both
parameters are 'true' by default.
If you need to re-enable the defaults:
1. Re-enable the bulk load mechanism for optimizing array inserts:
ALTER SYSTEM ALTER CONFIGURATION ('esserver.ini', 'SYSTEM') SET
('row_engine', 'bulk_inserts_as_load') = 'true' WITH RECONFIGURE;
2. Re-enable binary load (instead of the ASCII load):
ALTER SYSTEM ALTER CONFIGURATION ('esserver.ini', 'SYSTEM') SET
('row_engine', 'bulk_load_as_binary') = 'true' WITH RECONFIGURE;
236
PUBLIC
SAP HANA Troubleshooting and Performance Analysis Guide
Root Causes and Solutions
4 Tools and Tracing
This section gives you an overview of the available tools and tracing options that are available.
4.1 System Performance Analysis
As a rst step to resolving SAP HANA performance issues, you can analyze detailed aspects of system
performance in the SAP HANA studio on the Performance tab of the Administration editor.
When analyzing system performance issues, the information provided on the Performance tab enables you to
focus your analysis on the following questions:
• What and how many threads are running, what are they working on, and are any of these threads blocked?
• Are any sessions blocking current transactions?
• Are any operations running for a signicantly long time and consuming a lot of resources? If so, when will
they be nished?
• How do dierent hosts compare in terms of performance?
On the Performance tab, you can take certain actions to improve performance, including canceling the
operations that cause blocking situations. See the following topics in the guide SAP HANA Administration
with SAP HANA Studio
• Thread Monitoring
• Session Monitoring
• Blocked Transaction Monitoring
• Monitoring SQL Performance with the SQL Plan Cache
• Expensive Statements Monitoring
• Job Progress Monitoring
• Load Monitoring - use the load graph for performance monitoring and analysis; for example, to get a
general idea about how many blocked transactions exist now and in the past, or troubleshoot the root
cause of slow statement performance.
Related Information
Monitoring and Analyzing Performance in SAP HANA Studio
SAP HANA Troubleshooting and Performance Analysis Guide
Tools and Tracing
PUBLIC 237

4.2 SQL Statement Analysis
A key step in identifying the source of poor performance is understanding how much time SAP HANA
spends on query execution. By analyzing SQL statements and calculating their response times, you can better
understand how the statements aect application and system performance.
You can analyze the response time of SQL statements with the following traces:
• SQL trace
From the trace le, you can analyze the response time of SQL statements.
• Expensive statements trace
On the Performance Expensive Statements Trace tab, you can view a list of all SQL statements that
exceed a specied response time.
In addition to these traces, you can analyze the SQL plan cache, which provides a statistical overview of what
statements are executed in the system.
4.2.1Analyzing SQL Traces
The SQL trace allows you to analyze the response time of SQL statements within an object.
Procedure
1. In the Administration editor, choose the Trace Conguration trace and edit the SQL trace.
2. In the Trace Conguration dialog box, specify a name for the trace le, set the trace status to Active, and
specify the required trace and user lters.
3. Choose Finish.
4. Run the application or SQL statements you want to trace.
5. Re-open the SQL trace conguration and set the trace status to Inactive.
6. Choose Finish.
7. Choose the Diagnosis Files tab and open the trace le you created.
8. Choose Show Entire File.
9. Analyze the response time of the relevant SQL statements to identify which statements negatively aect
performance.
The SQL statements in the trace le are listed in order of execution time. To calculate the response
time of a specic SQL statement, calculate the dierence between the times given for # tracing
PrepareStatement_execute call and # tracing finished PrepareStatement_execute.
238
PUBLIC
SAP HANA Troubleshooting and Performance Analysis Guide
Tools and Tracing
4.2.1.1 SQL Trace
The SQL trace collects information about all SQL statements executed on the index server (tenant database)
or name sever (system database) and saves it in a trace le for further analysis. The SQL trace is inactive by
default.
Information collected by the SQL trace includes overall execution time of each statement, the number of
records aected, potential errors (for example, unique constraint violations) that were reported, the database
connection being used, and so on. The SQL trace is a good starting point for understanding executed
statements and their potential eect on the overall application and system performance, as well as for
identifying potential performance bottlenecks at statement level.
SQL Trace Files
SQL trace information is saved as an executable python program (by default sqltrace_<...>.py), which can
be used to replay the traced database operations. You can also use the SQL Trace Analyzer tool to automate
the analysis of the le.
Enabling and Conguring the SQL Trace
You can enable and congure the SQL trace in the SAP HANA database explorer or SAP HANA studio.
Alternatively, you can modify the parameters in thesqltrace section of the indexserver.ini (tenant
database) or nameserver.ini (system database).
Example
Use the following statement to enable the SQL trace:
ALTER SYSTEM ALTER CONFIGURATION ('indexserver.ini', 'SYSTEM') SET ('sqltrace',
'trace') = 'on' WITH RECONFIGURE
Recommendation
Do not leave the SQL trace enabled all the time as writing trace les consumes storage space on the disk
and can impact database performance signicantly.
Trace Levels
You can set the level for the SQL trace by changing the value of the conguration parameter [sqltrace]
level in the indexserver.ini le (tenant database) or nameserver.ini le (system database). Trace
information includes details such as executed timestamp, thread ID, connection ID, and statement ID.
Trace Level
Description
NORMAL All statements that have nished successfully are traced.
SAP HANA Troubleshooting and Performance Analysis Guide
Tools and Tracing
PUBLIC 239
Trace Level Description
ERROR All statements that returned errors are traced.
ERROR_ROLLBACK All statements that are rolled back are traced.
ALL All statements including status of normal, error, and rollback are traced.
ALL_WITH_RESULTS In addition to the trace generated with trace level ALL, the result returned by select state-
ments is also included in the trace le.
Note
An SQL trace that includes results can quickly become very large.
Caution
An SQL trace that includes results may expose security-relevant data, for example,
query result sets.
Trace Details
You can congure trace detail information by setting the parameter [sqltrace] details. You can select
one or more categories of information to include in the trace, for example: 'basic,resource_consumption'.
Possible values are listed in the following table. Note that for resource consumption information (this is also
included in the 'all' option) the following two parameters in the global.ini le [resource_tracking]
section, must be set to 'on':
• enable_tracking
• memory_tracking
You may also wish to limit the maximum memory allocation per statement by setting a value for the
[memorymanager] statement_memory_limit parameter in the global.ini le. Set this to 5, for
example, to apply a limit of 5GB.
Trace Details
Description
basic Connection information and statement information (default)
all Include all comments of connection and statement
user_variables User-dened variables in the session context
statement Statement information such as executed timestamp, thread ID, connection ID, statement
ID, statement hash and duration
session_variables System-dened variables in the session context
resource_consumption Statement resource consumption information such as local (+remote, if available) cpu-
time and memory-size.
passport Decoded passport contents
connection Connection information such as session ID, transaction ID, client PID, client IP, user name,
schema name, and session variable:value pairs
240 PUBLIC
SAP HANA Troubleshooting and Performance Analysis Guide
Tools and Tracing

Trace Details Description
"empty" Trace without these comments
Additional Conguration Options
Option
Conguration Parameter Default Description
Trace le name
tracefile sqltrace_$
HOST_$
{PORT}_$
{COUNT:3}.
py
User-specic name for the trace le
If you do not enter a user-specic le name, the
le name is generated according to the following
default pattern:
DB_<dbname>/sqltrace_$HOST_$
{PORT}_${COUNT:3}.py, where:
• DB_<dbname> is the sub-directory where the
trace le is written if you are running on a ten-
ant database
• $HOST is the host name of the service (for
example, indexserver)
• $PORT is the port number of the service
• $COUNT:3 is an automatically generated 3-
digit number starting with 000 that incre-
ments by 1 and serves as a le counter when
several les are created.
User, applica-
tion, object, and
statement l-
ters
user
Empty string Filters to restrict traced statements to those of
particular database or application users and appli-
cations, as well as to certain statement types and
specic objects (tables, views, procedures).
All statements matching the lter criteria are re-
corded and saved to the specied trace le.
For user, application_user, and
application the use of wildcards is supported
(see following subsection Using Wildcards).
application_user
application
object
statement_type
Flush limit
flush_interval
16 During tracing, the messages of a connection are
buered. As soon as the ush limit number of mes-
sages is buered (or if the connection is closed),
those messages are written to the trace le.
When set to 0, every SQL trace statement is imme-
diately written to the trace le
Using Wildcards
If you apply lters for the user, application_user, and application parameters, the use of wildcards
and exceptions is also supported. The asterisk wildcard character denotes any number of characters and the
exclamation mark denotes an exclusion. For example:
user=SM*,JONES,!GREEN,!BRO*
In this case all users starting with SM will be traced, JONES will be traced, user GREEN will not be traced and
all users starting with BRO will not be traced. If terms in the string conict with each other then the sequence in
SAP HANA Troubleshooting and Performance Analysis Guide
Tools and Tracing
PUBLIC 241

which the terms occur determines the result. In the following example user SMALL will be traced in spite of the
exclusion; the exclusion is ignored because it occurs after the rst wildcard.
user=SM*,JONES,!SMALL,!BRO*
Trace File Rotation
The size and number of trace les are controlled by the following parameters.
Parameter
Default Description
max_files
1
Sets the maximum number of trace
les
filesize_limit
1610612736 (or 1.5 GB)
Sets the maximum size of an individual
trace le in bytes
Caution
If both the maximum number of les and the maximum le size are reached, SQL tracing stops. If this
happens, you can increase the values of max_files and filesize_limit. See SAP Note 2629103.
SAP HANA SQL Trace Analyzer
SAP HANA SQL trace analyzer is a Python tool you can use to analyze the HANA SQL trace output. The tool
gives you an overview of the top SQL statements, the tables accessed, statistical information on dierent
statement types and on transactions executed.
For more information about the installation and usage of SAP HANA SQL trace analyzer, see SAP Knowledge
Base Article 2412519 FAQ: SAP HANA SQL Trace Analyzer.
Related Information
Diagnostic Files and Logs
SAP Note 2412519
SAP Note 2629103
242
PUBLIC
SAP HANA Troubleshooting and Performance Analysis Guide
Tools and Tracing

4.2.2Analyzing Expensive Statements Traces
The expensive statements trace allows you to identify which SQL statements require a signicant amount of
time and resources.
Procedure
1. In the Administration editor, choose the Trace Conguration trace and edit the expensive statements trace.
2. In the Trace Conguration dialog box, set the trace status to Active and specify a threshold execution time
in microseconds.
The system will identify any statements that exceed this threshold as expensive statements.
3. Choose Finish.
4. Run the application or SQL statements you want to trace.
5. Choose the Performance Expensive Statements Trace tab.
6. Analyze the displayed information to identify which statements negatively aected performance.
For each SQL statement, the following columns are especially useful for determining the statement's
impact on performance:
• START_TIME
• DURATION_MICROSEC
• OBJECT_NAME (names of the objects accessed)
• STATEMENT_STRING
• CPU_TIME
4.2.2.1 Expensive Statements Trace
Expensive statements are individual SQL statements whose execution time exceeds a congured threshold.
The expensive statements trace records information about these statements for further analysis and is inactive
by default.
If, in addition to activating the expensive statements trace, you enable per-statement memory tracking, the
expensive statements trace will also show the peak memory size used to execute the expensive statements.
Expensive Statements Trace Information
If you have the TRACE ADMIN privilege, then you can view expensive statements trace information in the
following ways:
• In the Expensive Statements app of the SAP HANA cockpit
• In the Statement Library in SAP HANA database explorer by searching for Expensive Statements Analysis.
SAP HANA Troubleshooting and Performance Analysis Guide
Tools and Tracing
PUBLIC 243
• In the M_EXPENSIVE_STATEMENTS system view
Enabling and Conguring the Expensive Statements Trace
You can enable and activate the expensive statements trace in the SAP HANA cockpit or the SAP HANA
database explorer. Alternatively, you can modify the parameters in the expensive_statement section of the
global.ini conguration le. If you set a value for more than one of the three threshold lters a statement
that exceeds any one of the lters is selected as an expensive statement; it is not necessary for all lters you
apply to be exceeded.
Conguration Options
Note
The following table shows the conguration parameters which are available; not all of these may be
available in the SAP HANA cockpit or the SAP HANA database explorer.
Option
Conguration Parameter Default Value Description
Trace status
enable
off
Species the activation status of the trace.
Threshold CPU
time
threshold_cpu_time
-1 (disabled)
Species the threshold CPU time of statement exe-
cution in microseconds.
When set to 0, all SQL statements are traced.
Note
Resource tracking and CPU time tracking
must also be enabled. You can do this by
conguring the corresponding parameters in
the resource_tracking section of the
global.ini le.
Threshold
memory
threshold_memory
-1 (disabled)
Species the threshold memory usage of state-
ment execution in bytes.
When set to 0, all SQL statements are traced.
Note
Resource tracking and memory tracking must
also be enabled. You can do this by con-
guring the corresponding parameters in
the resource_tracking section of the
global.ini le.
244 PUBLIC
SAP HANA Troubleshooting and Performance Analysis Guide
Tools and Tracing
Option Conguration Parameter Default Value Description
Threshold dura-
tion
threshold _duration
1000000 ( mi-
croseconds = 1
second )
Species the threshold execution time in microsec-
onds.
When set to 0, all SQL statements are traced. In
the SAP HANA database explorer, you can set the
threshold duration to be measured in seconds or
milliseconds.
User, applica-
tion, and object
lters
user
Empty string Species lters to restrict traced statements
to those of a particular database, application
user, application, or tables/views. For user,
application_user, and application the
use of wildcards is supported (see following sub-
section Using Wildcards).
application_user
application
object
Passport trace
level
passport_tracelevel
Empty string
If you are activating the expensive statements trace
as part of an end-to-end trace scenario with the
Process Monitoring Infrastructure (PMI), you can
specify the passport trace level as an additional l-
ter.
This means that only requests that are marked with
a passport of the specied level are traced.
Note
Process tracing is possible only for compo-
nents in the ABAP and Business Objects
stacks.
Trace parame-
ter values
trace_parameter_values
true
In SQL statements, eld values may be specied
as parameters (using a "?" in the syntax). If these
parameter values are not required, then you can
disable this setting to reduce the amount of data
traced.
Trace ush in-
terval
trace_flush_interval
10 Species the number of records after which a trace
le is ushed.
Use in-memory
tracing
use_in_memory_tracing
true
If in-memory tracing is active, then information is
cached in memory. Otherwise, the data is written
directly to le.
In-memory
tracing records
in_memory_tracing_reco
rds
30000
Species the maximum number of trace records
(per service) stored in memory.
This setting only takes eect when in memory trac-
ing is active.
Using Wildcards
If you apply lters for the user, application_user, and application parameters, the use of wildcards
and exceptions is also supported. The asterisk wildcard character denotes any number of characters and the
exclamation mark denotes an exclusion. For example:
user=SM*,JONES,!GREEN,!BRO*
SAP HANA Troubleshooting and Performance Analysis Guide
Tools and Tracing
PUBLIC 245

In this case all users starting with SM will be traced, JONES will be traced, user GREEN will not be traced and
all users starting with BRO will not be traced. If terms in the string conict with each other then the sequence in
which the terms occur determines the result. In the following example user SMALL will be traced in spite of the
exclusion; the exclusion is ignored because it occurs after the rst wildcard.
user=SM*,JONES,!SMALL,!BRO*
Trace File Rotation
To prevent expensive statement trace information from growing indenitely, you can limit the size and number
of trace les using the following parameters in expensive_statement of global.ini.
Parameter
Default Description
maxfiles
10
Species the maximum number of
trace les.
When the maximum number of trace
les reached, the oldest trace le is de-
leted and a new one opened.
When set to 0, trace le rotation is disa-
bled.
maxfilesize
10000000 (or 9.5 megabytes)
Species the maximum size of an indi-
vidual trace le in bytes.
When the maximum number of les
is greater than 1 and the maximum
le size is reached, a new trace le is
opened.
When the maximum number of les
is 1, the maximum le size is greater
than zero, and the maximum le size is
reached, the trace le is deleted and a
new one opened.
Related Information
Setting a Memory Limit for SQL Statements [page 79]
Monitoring and Analyzing Expensive Statements (SAP HANA Cockpit)
Expensive Statements Monitoring (SAP HANA Studio)
M_EXPENSIVE_STATEMENTS System View
SAP Note 2180165
4.2.3Analyzing SQL Execution with the SQL Plan Cache
The SQL plan cache is a valuable tool for understanding and analyzing SQL processing.
Before it is executed, every SQL statement is compiled to a plan. Once a plan has been compiled it is better to
reuse it the next time the same statement is executed rather than compiling a new plan every time. The SAP
246
PUBLIC
SAP HANA Troubleshooting and Performance Analysis Guide
Tools and Tracing

HANA database provides an object, the SQL plan cache, that stores plans generated from previous executions.
Whenever the execution of a statement is requested, an SQL procedure checks the SQL plan cache to see
if there is a plan already compiled. If a match is found, the cached plan is reused. If not, the statement is
compiled and the newly generated plan is cached.
As the SQL plan cache collects statistics on the preparation and execution of SQL statements it is an important
tool for understanding and analyzing SQL processing. For example, it can help you to nd slow queries as well
as to measure the overall performance of your system.
Various options are available for analyzing the plan cache for a statement:
• In SAP HANA cockpit the link for SQL Plan Cache is available in the Monitoring group.
• In SAP HANA studio SQL Plan Cache is a sub-tab of the Performance tab.
• The two system views associated with the SQL plan cache are M_SQL_PLAN_CACHE_OVERVIEW and
M_SQL_PLAN_CACHE.
The SQL plan cache contains a lot of information. Filtering according to the following columns can help you
identify statements that are more likely to be causing problems and/or could be optimized:
Column
Description
TOTAL_EXECUTION_TIME The total time spent for all executions of a plan
This helps to identify which statements are dominant in terms of time.
AVG_EXECUTION_TIME The average time it takes to execute a plan execution
This can help you identify long-running SQL statements.
EXECUTION_COUNT The number of times a plan has been executed
This can help you identify SQL statements that are executed more frequently than ex-
pected.
TOTAL_LOCK_WAIT_COUNT The total number of waiting locks
This can help you identify SQL statements with high lock contention.
USER_NAME The name of the user who prepared the plan and therefore where the SQL originated
(ABAP/index server/statistics server)
For a full list of all SQL cache columns including descriptions, see the documentation for the system
views M_SQL_PLAN_CACHE_OVERVIEW and M_SQL_PLAN_CACHE in the SAP HANA SQL and System
Views Reference. Refer also to the sections on Managing the Performance of SAP HANA in the SAP HANA
Administration Guide.
Related Information
Managing and Monitoring SAP HANA Performance
SAP HANA SQL Reference Guide for SAP HANA Platform
SQL Plan Cache Analysis [page 185]
SAP HANA Troubleshooting and Performance Analysis Guide
Tools and Tracing
PUBLIC 247

4.3 Query Plan Analysis
In SAP HANA, to identify queries that are ineciently processed, you can both technically and logically analyze
the steps SAP HANA took to process those queries.
From a technical perspective, analyzing query plans allows you to identify long running steps, understand
how much data is processed by the operators, and see whether data is processed in parallel. However, if you
understand the idea and purpose behind the query, you can also analyze query plans from a logical perspective
and consider questions such as:
• Does SAP HANA read data from multiple tables when only one is required?
• Does SAP HANA read all records when only one is required?
• Does SAP HANA read the best table, possibly a large table even though another table has a much smaller
result set?
To gain the insight you need to answer such questions, the following tools are available for query plan analysis:
• Plan explanation
• Plan visualization
Both tools are available as SQL commands but are also integrated into administration tools. Refer to SAP Note
2073964 - Create & Export PlanViz in HANA Studio for an introduction to using PlanViz in SAP HANA studio.
Tip
In some releases of HANA 1 and early releases of HANA 2 there were a number of known issues related to
the Plan visualization trace, these are documented in the KBA 2119087 - How-To: Conguring SAP HANA
Traces (section ‘PlanViz / Execution trace’). To avoid any issues you can use Explain Plan as an alternative
to Plan Visualization trace.
Related Information
SAP Note 2119087
SAP Note 2073964
4.3.1Analyzing SQL Execution with the Plan Explanation
You can generate a plan explanation for any SQL statement and use this to evaluate the execution plan;
you may be able to use this information to optimize the query by reducing the run time or the memory
consumption.
The Explain Plan can be collected in several dierent ways:
• By running the EXPLAIN PLAN SQL statement
• In the SQL console of SAP HANA studio
248
PUBLIC
SAP HANA Troubleshooting and Performance Analysis Guide
Tools and Tracing
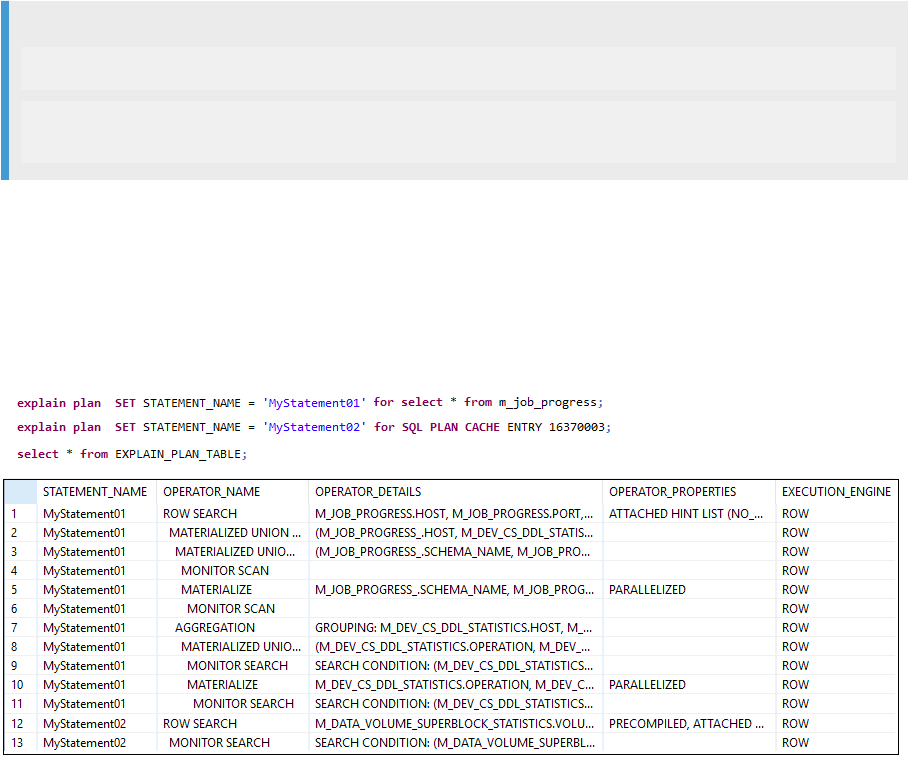
• From within DBACOCKPIT.
Running EXPLAIN PLAN from the SQL Command Line
The SQL command oers two options: to capture the results directly from the query or capture from an
existing entry in the plan cache. The results of these two options may vary because in the rst case Explain Plan
is based on the prepared SQL statement not on the executed statement. If, on the other hand, you run Explain
Plan for a statement which has been executed and is available in the cache, then additional parameter aware
optimization will already have been applied. See also SAP Note 2410208 - Collect Explain Plan of a Prepared
Statement.
After running Explain Plan, the plan results are saved in the EXPLAIN_PLAN_TABLE. An additional option
available is to give the plan details a recognizable name (STATEMENT_NAME value) so that your results are
easily identiable, see the following example.
The SQL syntax for the two options is as follows:
Code Syntax
EXPLAIN PLAN [SET STATEMENT_NAME = *<statement_name>*] FOR SELECT *<subquery>*
EXPLAIN PLAN [SET STATEMENT_NAME = *<statement_name>*] FOR SQL PLAN CACHE
ENTRY *<sql_plan_id>*
<statement_name> String literal. Used to identify the name of a specic execution plan in the output table
for a given SQL statement. It is set to NULL if the STATEMENT_NAME is not specied.
<subquery> An SQL statement.
<sql_plan_id> An SQL plan id (in sql plan cache).
The following illustration shows the usage of the two options and the statement name value:
SAP HANA Troubleshooting and Performance Analysis Guide
Tools and Tracing
PUBLIC 249
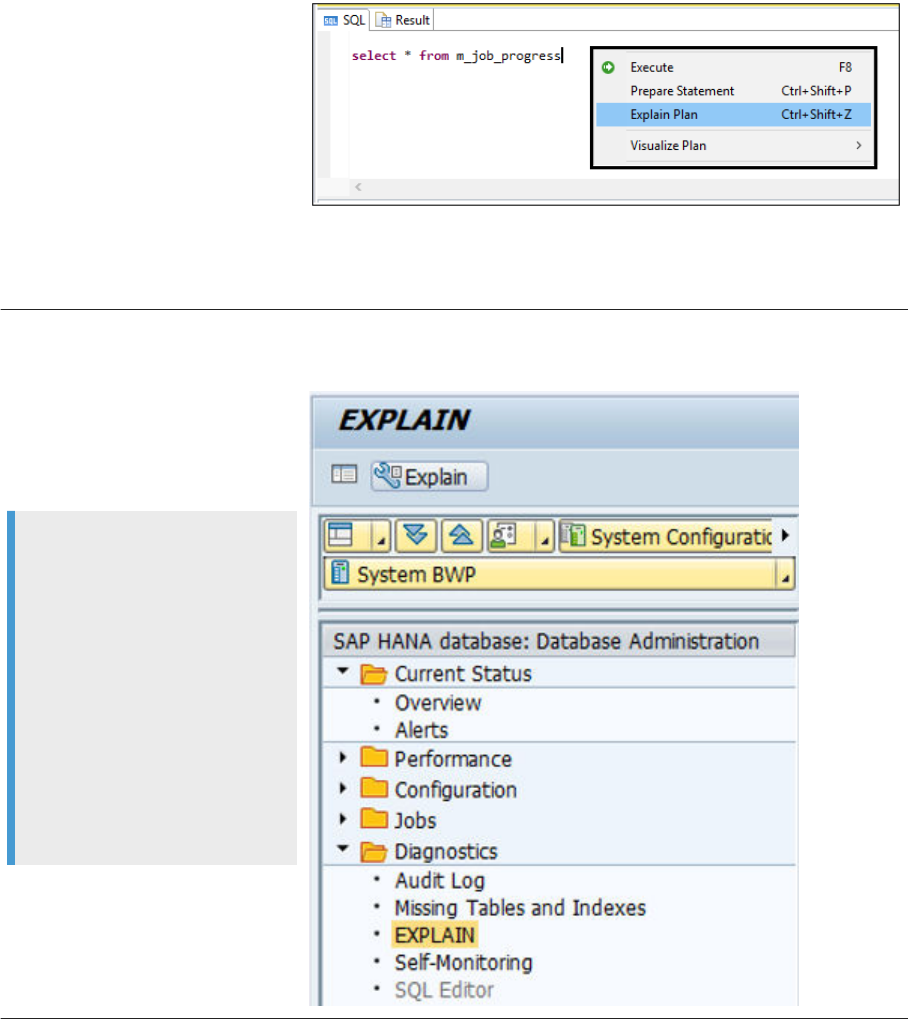
Explain Plan in SAP HANA Studio
Enter a statement in the SQL
console of SAP HANA studio and
before executing the command choose
Explain Plan in the context menu.
You can enter multiple statements
separated by a semicolon to generate
several plan explanations at once.
The plan explanation is then displayed
on the Result tab and stored in the
EXPLAIN_PLAN_TABLE view of the
SYS schema for later examination.
Explain Plan in DBACOCKPIT
The Explain Plan results can
also be collected from transaction
DBACOCKPIT on the application
server:
Note
From DBACOCKPIT you will only
see partial information on the
explain plan, in the output
you will see the Operations
executed and the order they
were executed in but not the
information on cost and table size
estimations (OUTPUT_SIZE and
SUBTREE_COST). It is possible
to get this missing information
by taking the executed statement
from the plan cache and executing
the statement again.
How to use the Explain Plan to optimize a query:
The execution plan shows important detailed information on the query execution and the background
operations. Some of the key values are described briey here and in the examples which follow, refer to the
EXPLAIN_PLAN_TABLE system view in the SAP HANA SQL and System Views Reference for full details.
250
PUBLIC
SAP HANA Troubleshooting and Performance Analysis Guide
Tools and Tracing
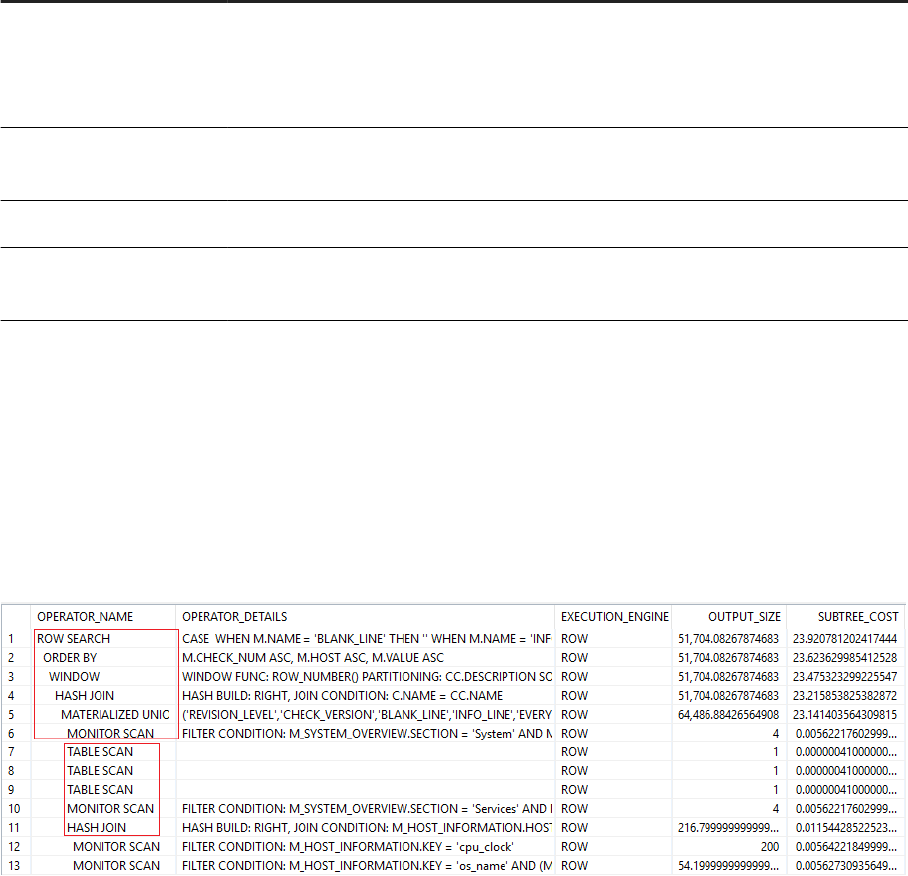
Area Detail
Operation details The OPERATOR_NAME value shows the type of operation which was executed, such as
joins, unions, aggregations and so on. Operations depend on the engine used - essentially
row engine or column engine. Dependencies are shown by indentation - see examples
below.
Engine The type of engine where an operator is executed is shown in the EXECUTION_ENGINE
column: ROW, COLUMN, OLAP, HEX, ESX.
Table details Table details include table name, type, size, tables or objects which were accessed.
Estimated cost Cost values include the estimated output row count (OUTPUT_SIZE) and the estimated
time in seconds (SUBTREE_COST).
Example 1
The following illustrations and commentary show how the information returned can be used.
We can see the OUTPUT_SIZE and SUBTREE_COST estimations for the various operations. The cost value is
used for the cost-based optimizer to choose the best plan; generally, the smaller the subtree cost, the better
the performance.
We can see that for the operations 1-13 the ROW store engine is used and that the operations 1-5 are executed
sequentially (OPERATOR_NAME values indented incrementally) and that operations 6-11 are executed in
parallel (left-aligned together):
Possible Optimizations
In this example, it may be possible to adjust the query so that more steps can be executed in parallel, or it
may be possible to change the query operations so that the column store engine is used instead of the row
store engine if a similar operator exists for the column store engine. You can use query hints to inuence how a
query is executed, for example, the hint use_olap_plan will force the HANA database to use the OLAP engine
instead of the join engine where this is technically possible. The available hints for the SAP HANA database are
described in the SAP HANA SQL and System Views Reference.
Refer also to the knowledge base article 2142945 - FAQ: SAP HANA Hints.
SAP HANA Troubleshooting and Performance Analysis Guide
Tools and Tracing
PUBLIC 251
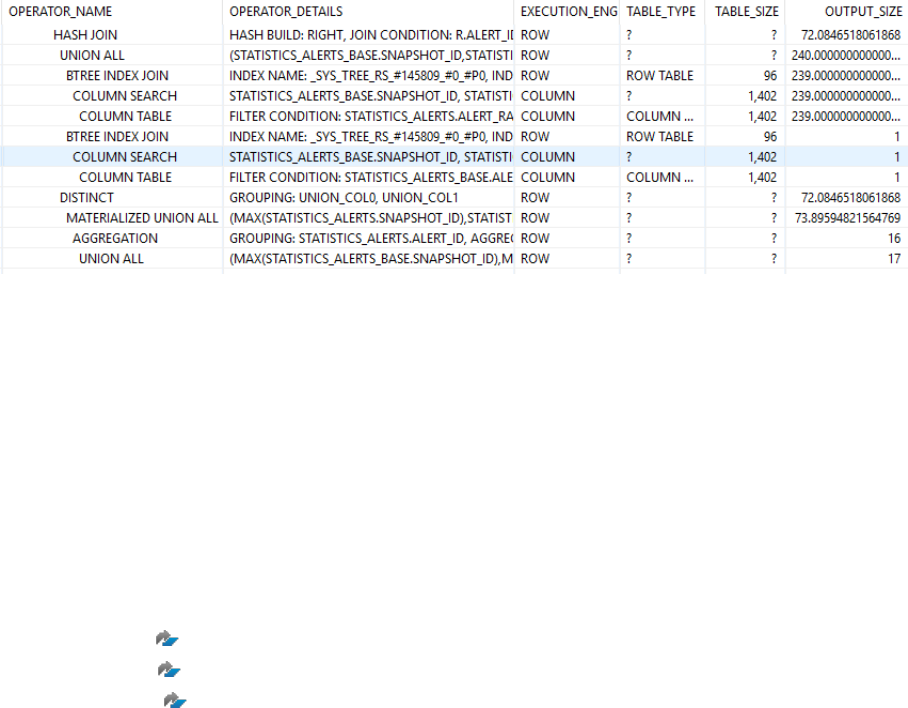
Example 2
In the following example lines we can see the execution engine switching between column and row store:
Where possible an engine switch should be avoided as it requires a materialization of intermediate results
and this is expensive in terms of both query performance and memory usage on HANA. It may be possible
therefore to optimize this query by adjusting it to avoid the engine switch.
For more information about optimization possibilities refer to:
• The examples given in the SAP HANA SQL and System Views Reference
• Knowledge base article 2000002 - FAQ: SAP HANA SQL Optimization.
Related Information
SAP Note 2142945
SAP Note 2410208
SAP Note 2000002
4.3.2Analyzing SQL Execution with the Plan Visualizer
To help you understand and analyze the execution plan of an SQL statement, you can generate a graphical view
of the plan.
Procedure
1. Visualize the plan of the SQL statement in one of the following ways:
a. Enter the statement in the SQL console and choose Visualize Plan in the context menu.
b. On the SQL Plan Cache tab or the Expensive Statements Trace tab of the Performance tab, right-click
the statement and choose Visualize Plan.
A graphical representation of the query, with estimated performance, is displayed.
Visualized Plan
252
PUBLIC
SAP HANA Troubleshooting and Performance Analysis Guide
Tools and Tracing
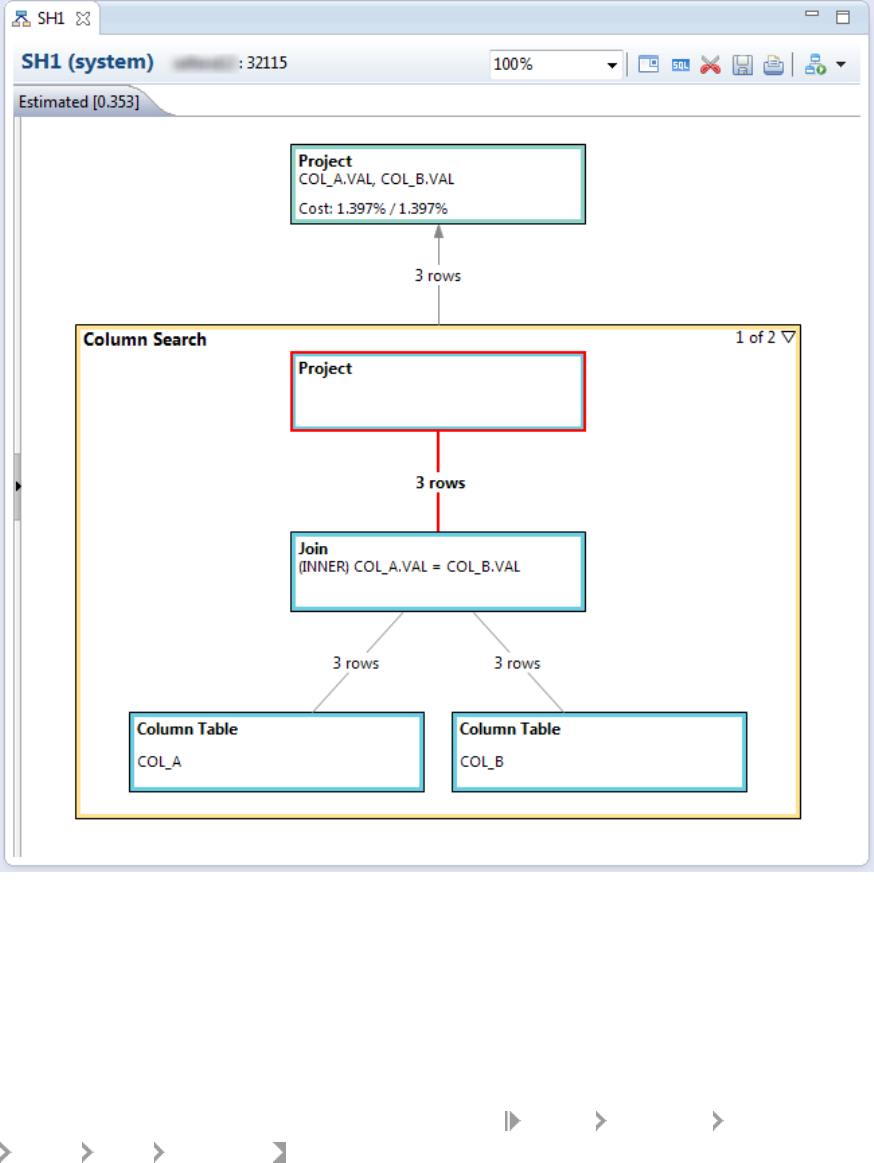
2. Validate the estimated performance by choosing Execute Plan in the context menu. Or use the shortcut key
F8
Another similar high-level graphic is generated with execution time information for each of the parts.
As of SPS 9, by default, a gray color indicates that the operator is not physical, meaning the operator
simply exists to give a more structured graph display.
Almost all of these non-physical operators can be removed from the graph if you prefer, by selecting 'None'
for the 'Node Grouping' option provided on the left of the graph.
Note: You can change the colors for each operator type under Window Preferences SAP HANA
PlanViz Graph Appearance .
Executed Plan
SAP HANA Troubleshooting and Performance Analysis Guide
Tools and Tracing
PUBLIC 253
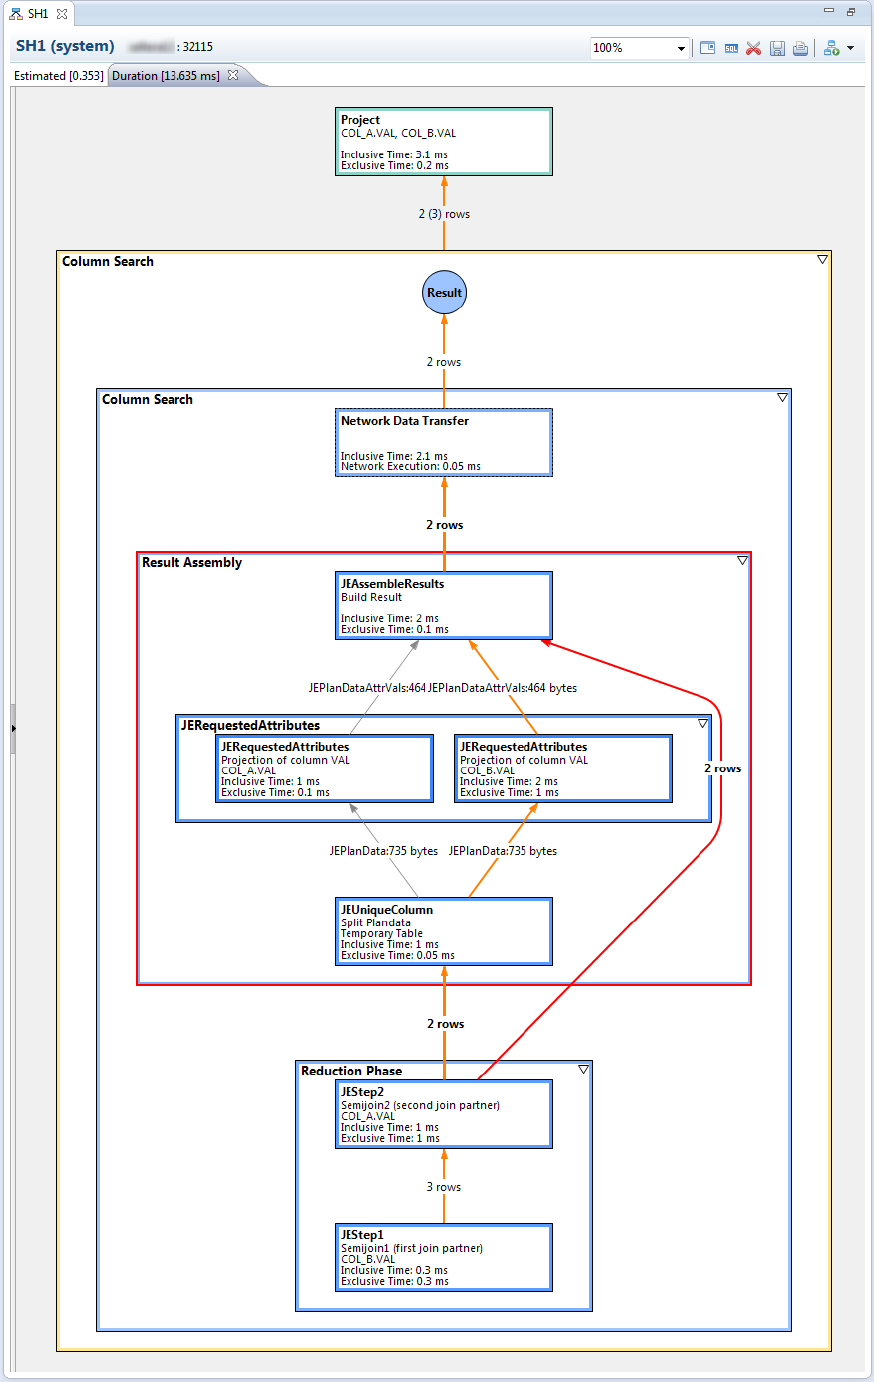
254 PUBLIC
SAP HANA Troubleshooting and Performance Analysis Guide
Tools and Tracing
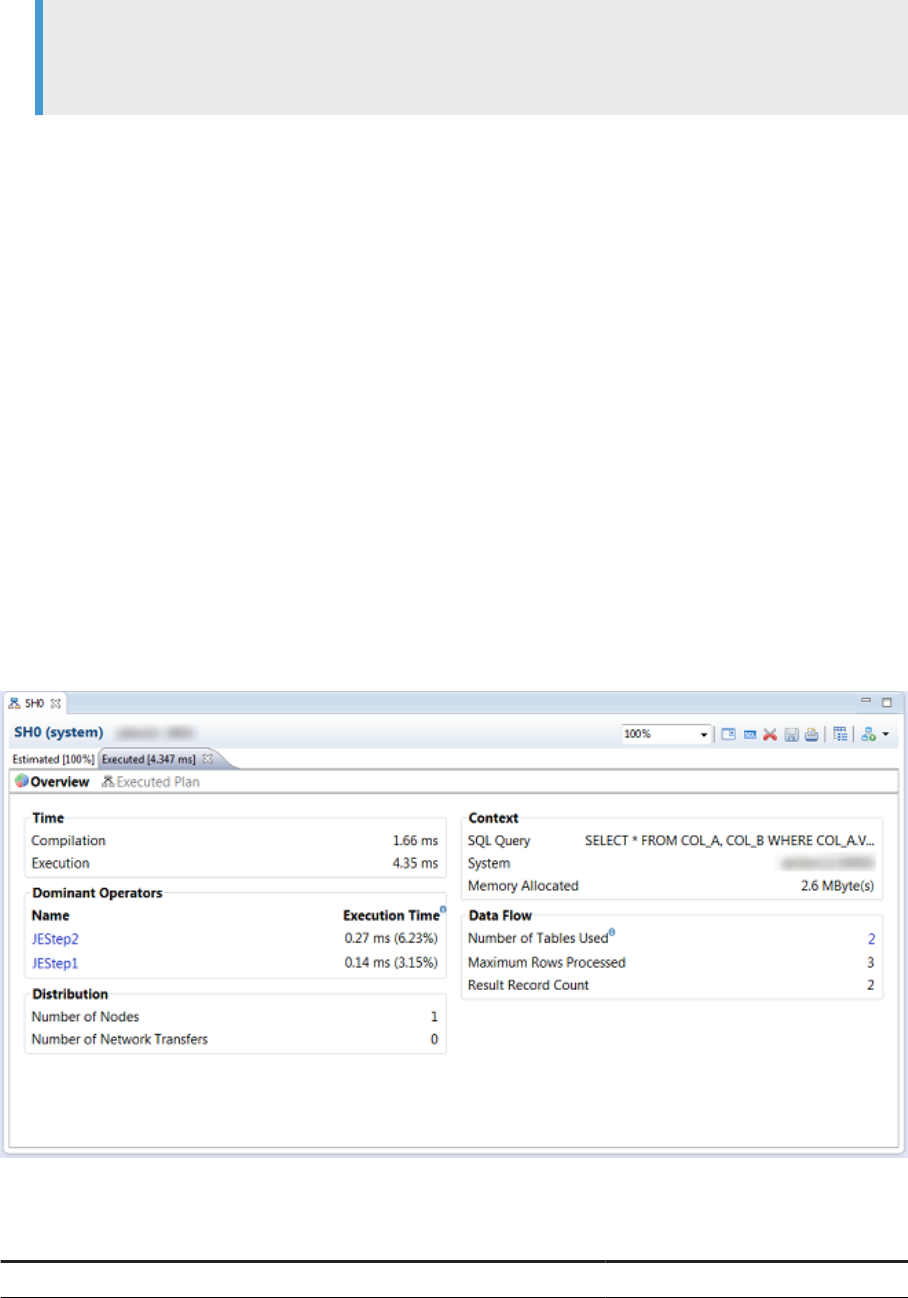
Note
Execution time is given as a pair of values: "Exclusive" (the execution time of the node), and "Inclusive"
(the execution time including the descendent nodes.
Results
This graphic is a very powerful tool for studying performance of queries on SAP HANA databases. You can
explore the graphic further, for example, you can expand, collapse, or rearrange nodes on the screen. You can
also save the graphic as an image or XML le, for example, so you can submit it as part of a support query.
4.3.2.1 Overview Page
Visualization of execution plans will automatically display an 'Overview' page
Starting from SPS 09 (client version), visualization of execution plans will automatically display an 'Overview'
page as you can see in the screenshot below. Some important KPIs required to begin a performance analysis
are provided so that you can rst get a big picture of what is going on before going into the complex details.
Overview Page
The following table describes the nature of each KPI:
KPI
Description Comment
Compilation Initial compilation time
SAP HANA Troubleshooting and Performance Analysis Guide
Tools and Tracing
PUBLIC 255
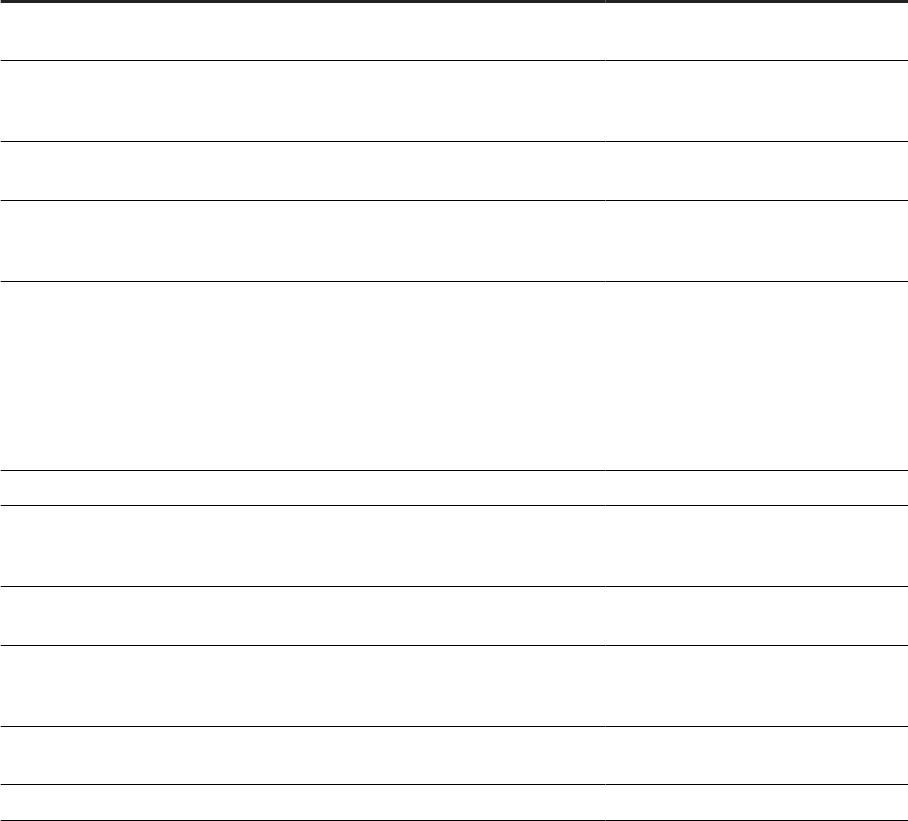
KPI Description Comment
Execution Total duration of the query excluding
compilation time
Dominant Operators Operators sorted by their execution
time (top 3)
You can click on any operator name to
move to the corresponding visualized
operator in the graph
Number of Nodes Number of servers involved in the exe-
cution
You can click on the value to see how
much time was spent in each node
Number of Network Transfers Total number of network transfers that
have occurred during execution
You can click on the value to open 'Net-
work View' which visualizes the trans-
fers in more detail
Dominant Network Transfers Network transfers sorted by their exe-
cution time (top 3)
You can click on any network transfer
to move to the corresponding visualized
transfer in the graph.
Note: This section only appears if the
query was executed in a distributed en-
vironment.
SQL Query
The statement that was executed
System The system where the execution oc-
curred (that is, where nal results are
fetched)
Memory Allocated Total memory allocated for executing
the statement
Number of Tables Used Total number of tables touched upon by
any operator during execution
You can click on the value to open the
'Tables Used View' for more detail re-
garding each table
Maximum Rows Processed The largest number of rows processed
by any single operator
Result Record Count The nal result record count
4.3.2.2 Statement Statistics
Visualization of execution plans for procedures displays a set of statistics for each SQL statement involved in a
procedure.
Context
This set of statistics is automatically visualized when a procedure is executed and it provides a good starting
point for analyzing performance of procedures as it lets you easily drill-down into the most expensive SQL
statements. Basic information such as execution count, execution/compile time, allocated memory size and
256
PUBLIC
SAP HANA Troubleshooting and Performance Analysis Guide
Tools and Tracing
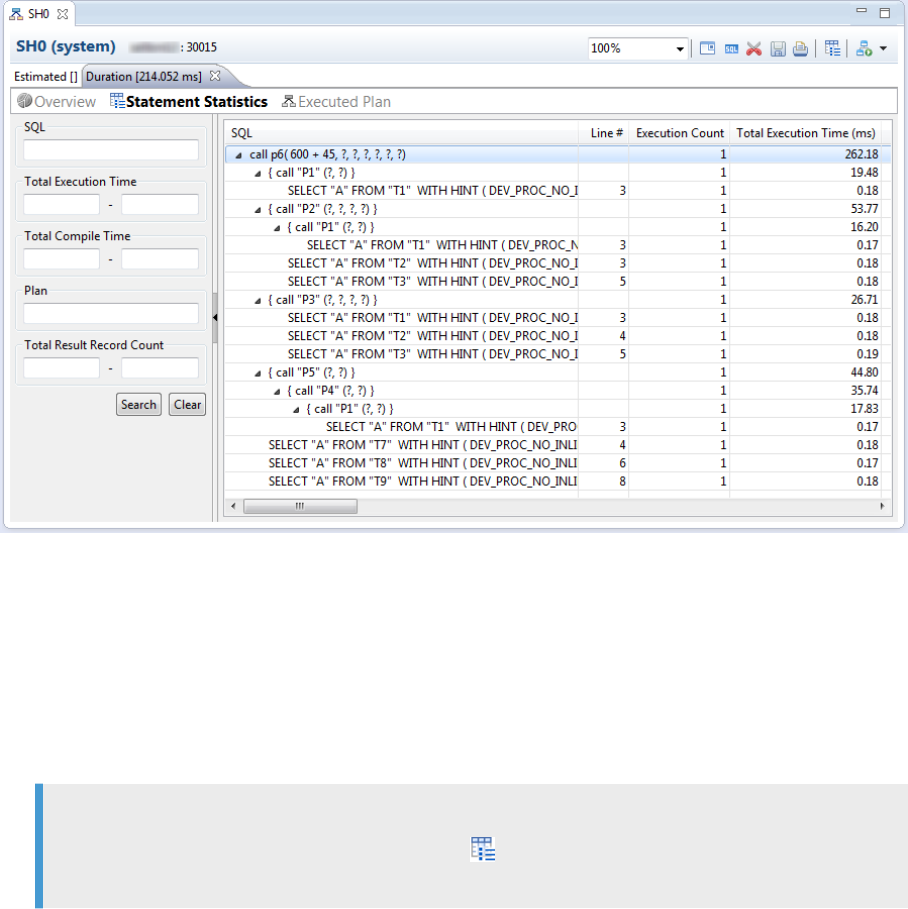
so on are provided for each statement so that you can sort the column (criterion) of interest to nd the most
expensive statement.
The following pieces of information are available: SQL Statement, Line Number, Execution Count, Execution
Times, Compilation Times, Memory Allocated, Result Record Count, Explain Plan Result, and Procedure
Comment
Statement Statistics view
By right-clicking on any element of the SQL statement, you will have access to these menus:
• Show Plan in Graph: Displays the execution plan corresponding to the selected statement in the context of
entire plan.
• Show Plan in New Window: Displays the execution plan corresponding to the selected statement ONLY in a
separate pop-up window.
• Execute Statement: Enables users to reproduce the execution of a single statement
Note
To use this feature, the 'Keep Temp Tables' button ( ) located on the top-right corner of a graph editor
(Plan Visualizer) must be toggled before obtaining the executed plan of the procedure under analysis.
Procedure
1. Open an SQL Console
2. Enter any procedure into the console and choose Visualize Plan from the context menu.
3. Choose F8 to see executed plan from the visualized plan.
SAP HANA Troubleshooting and Performance Analysis Guide
Tools and Tracing
PUBLIC 257

Statement Statistics will be shown automatically and it will list all the statements that were involved in the
procedure. You can use this view to drill down to the potential root-cause of a long running procedure. For
example you might detect a single statement that takes up most of the time and check whether this is
indeed expected or notice that an identical statement is repeatedly executed with varying statistics (for
example, big gap between minimum execution time and maximum execution time).
4.3.2.3 Timeline View
The Timeline view provides a complete overview of the execution plan based on visualization of sequential
time-stamps.
Context
The following pieces of information are available in the view:
• X-axis: time elapsed since query execution,
• Y-axis: list of operators
• Duration of each operator execution represented by rectangular bars
• The nature of each time-stamp (for example, open, fetch, close, and so on.)
The view supports:
• Synchronized selection with operators in graphical plan
• Hierarchical display of operators based on parent-child relationship
• Re-conguration of scales via a toolbar option
Procedure
1. To see a temporal breakdown of the individual operations processed in the execution of the query, open the
Timeline view.
From the main menu choose Window Show View Timeline .
Timeline View
258
PUBLIC
SAP HANA Troubleshooting and Performance Analysis Guide
Tools and Tracing
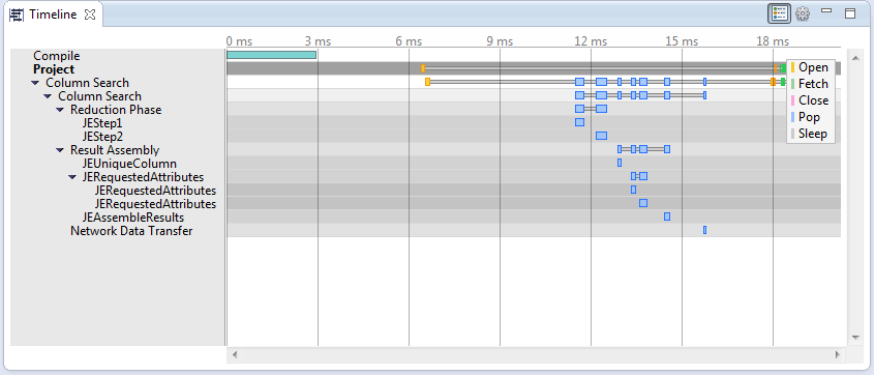
2. Use this view to drill down to the potential root-cause of a long running query:
For example you might
• Detect a single operator that takes up most of the time and check whether this is expected
• Notice that some operators are executed sequentially instead of running in parallel, so you might
check the system environment
Next Steps
However, users should take into account the following point and limitations when analyzing the Timeline view:
• Any gaps or multiple occurrence of 'open', 'fetch', and so on in the Column Search operator invoked by the
row engine indicates that there was another operation called by the column engine in the meantime.
• The adjustment for exclusivity of time-stamps as described above is not applicable for column engine
operators, meaning some operators may not be actually running in parallel but simply calling one another.
• Logical grouping operators for the column engine (those colored in gray) simply display the aggregated
time-stamps of their constituent operators.
4.3.2.4 Operator List for Plan Visualizer
The Operator List view is used within the context of the Plan Visualizer perspective. It lists detailed
characteristics of all operators within a current plan, both visualized and executed.
The Operator List can be used to dynamically explore the operator set along user dened lters in order to
pinpoint specic operators of interest. The view supports:
• Display of various KPIs, for example,. isPhysical (meaning whether an operator is a real, physically
executed one), oset, execution time, CPU time
• Setting of lters along all the columns and KPIs
• Display of the number of operators within the ltered set
SAP HANA Troubleshooting and Performance Analysis Guide
Tools and Tracing
PUBLIC 259

• Immediate aggregated information (max, min, sum, and so on) regarding the same KPIs on the lterd
operator set and the remaining set (not within the lter)
• Detailed display of all operators within the ltered set (which can be further sorted)
• Export of the (ltered) operator list to a CSV le
• Forwards and backwards browsing through the history of applied lters.
As of SPS 09 the following features are supported:
• Show or hide columns using the preferences dialog (preferences icon next to save button)
• Change the order of columns using drag and drop
• Order and column visibility are stored in users workspace
• Remote search functionality. Press Ctrl+F when displaying an executed plan and specify search
parameters. When you carry out a search the operator list is updated accordingly
Operator List
You can use the Operator List view to analyze the set of operators within a plan for the occurrence of specic
conditions, even before looking into the visualized plan. For example, you might
1. Filter all operators that process a certain number of (input) rows
2. Further restrict the lter to physical operators (using "x" as the search criteria in lter column "Physical")
3. Display the executed plan, press Ctrl+F and set "Execution Time - At least" to 50
4. Finally, double click on an operator you are interested in to check its positioning within a visualized plan.
4.3.2.5 Network View
The Network View can visualize sequential network data transfers between dierent servers based on their
given timestamps when an execution plan is based on a distributed query.
Context
The following pieces of information are available in the view:
• X-axis: servers involved,
• Y-axis: time elapsed since query execution
260
PUBLIC
SAP HANA Troubleshooting and Performance Analysis Guide
Tools and Tracing
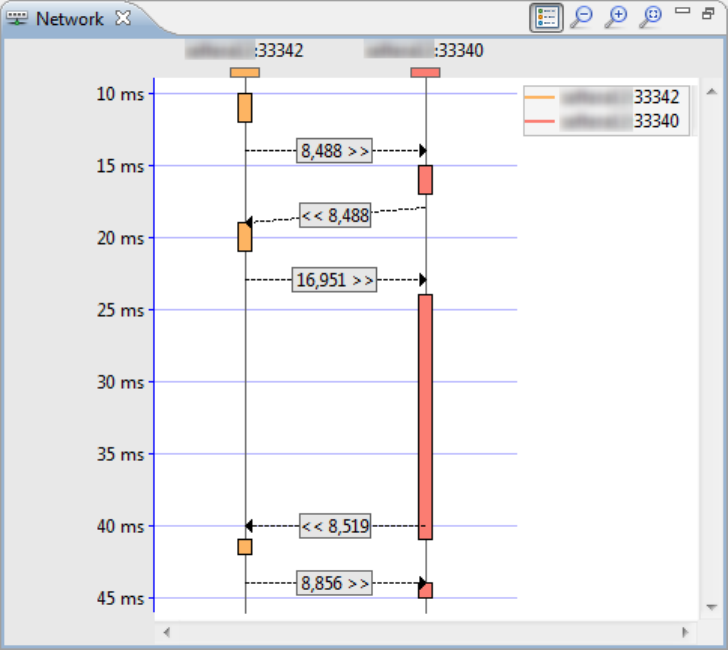
• Duration of each operator represented by rectangular bars
• Size of data transferred in bytes
The view supports:
• Synchronized selection with network operators in graphical plan
• Hover information for network bars
• Zoom in and out
You may use this view to discover any issues related to a distributed environment.
Procedure
1. Open the view
2. Check the results
For example you might notice that an unusually long time is spent on a particular network data transfer,
so you might check the data size and/or network condition and see that network data transfers occur too
frequently between a particular set of servers, so you might improve the distribution set-up.
3. Optimize your distributed landscape based on the results.
SAP HANA Troubleshooting and Performance Analysis Guide
Tools and Tracing
PUBLIC 261
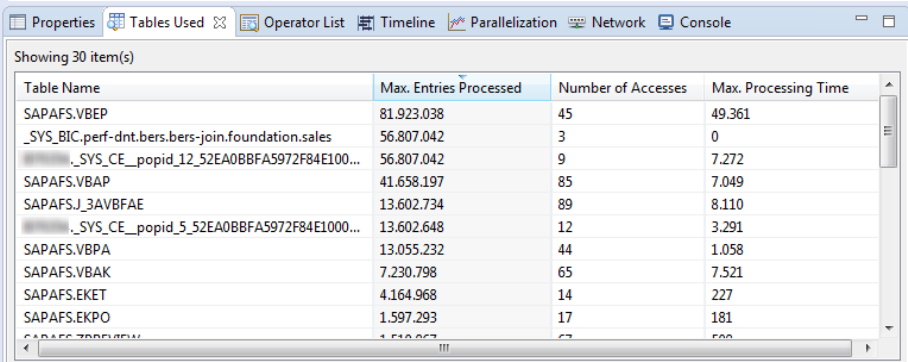
4.3.2.6 Tables Used
The table usage view provides an overview on which tables have been used during the processing of a
statement.
Context
The Tables Used view can be used to cross-check your business understanding about which tables are needed
to fulll a given SQL statement.
The view displays 3 metrics per table:
• Maximum number of entries processed, that is the overall output cardinality of any processing step on that
table in the statement execution.
• Number of accesses, meaning how often a table has been accessed during statement execution
• Maximum processing time, that is the maximum processing time across the possibly multiple table
accesses
The view content can be sorted along any column; double-clicking on any row (table) leads to a corresponding
operator list ltered for physical operators accessing the selected table.
You may use this view to understand whether the data processing of your statement matches your business
expectations.
Procedure
1. Review the tables used in your SQL.
You may detect a table that has been processed which should not be needed from a business perspective,
so you might modify you SQL in a way that this table is no more used.
2. Review the number of times a table is accessed.
262
PUBLIC
SAP HANA Troubleshooting and Performance Analysis Guide
Tools and Tracing
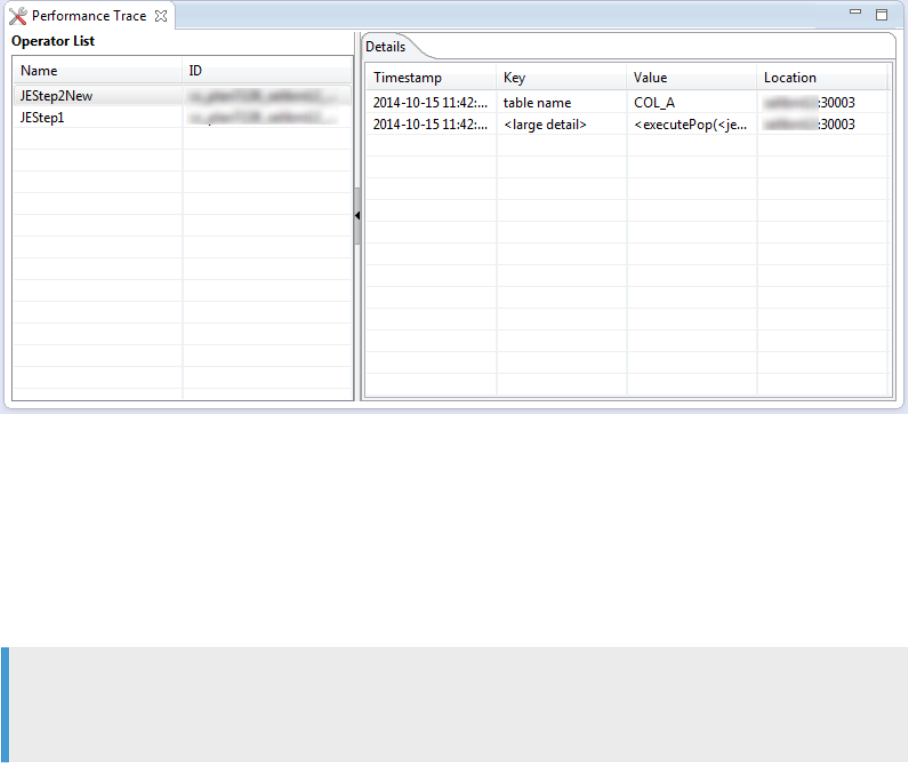
You may see that the number of processed entries is far higher than expected, so you can check if it is
possible to improve the ltering in your SQL statement.
4.3.2.7 Performance Trace
The Performance Trace view displays the list of operators that have performance trace data. The data can be
viewed by selecting any of the operator shown in the list.
Context
The view consists of two main sections:
• The left panel shows list of operators you can select to view performance trace data
• The right panel shows the performance trace data for the operator you have selected
The view supports:
• synchronized selection between operators visualized in the graph
• double-clicking on a particular data to view its full-text
Note
This view is mainly targeted towards advanced users who are well acquainted with the core details of SAP
HANA.
SAP HANA Troubleshooting and Performance Analysis Guide
Tools and Tracing
PUBLIC 263
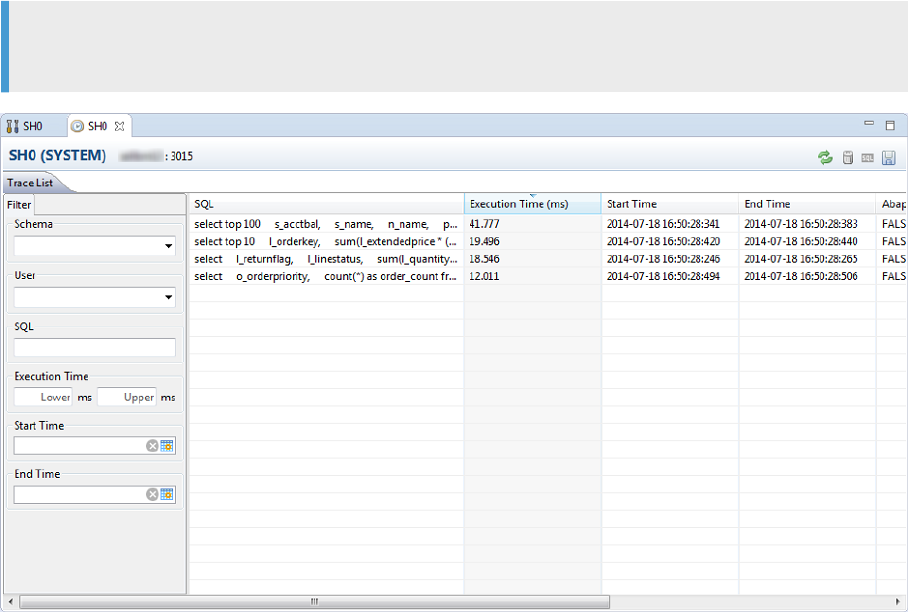
Procedure
1. Look for any additional properties relevant to a particular operator that you cannot nd from other views.
2. Fill in missing gaps in the Timeline view by deducing from the sequential list of activities.
3. Further break-down a specic operation into core engine-level details.
4.3.2.8 Plan Trace
Use the plan trace to collect SQL queries and their execution plans, executed in a given time frame for a
particular application session.
Context
The plan trace enables you to capture details of selected SQL queries and their execution plans. For each SQL
query traced, you can visualize the execution plan to conduct further performance analysis.
Note
The plan trace captures only SELECT statements.
Plan Trace Editor Displaying the List of Traced Queries
264
PUBLIC
SAP HANA Troubleshooting and Performance Analysis Guide
Tools and Tracing
Procedure
1. Open the SQL Console.
2. Enable the plan trace and congure its parameters.
a. Go to the Administration editor and then select Performance Sessions tabs.
To open the Administration editor, right-click on a database session you wish to trace and from the
context menu select Conguration and Monitoring Open Administration .
Note
You can also directly access the Trace Conguration dialog by selecting the Trace Conguration tab
within the Administration editor. Skip step 2b in this case.
b. Right-click on the session corresponding to the SQL Console opened in step 1 and from the context
menu, choose
Congure Trace Plan Trace .
The corresponding session has the keyword 'SQLExecuteFormEditor in the Application Source column.
The Trace Conguration dialog opens.
c. Select Start Tracing, congure the plan trace parameter as needed and click Finish.
3. Execute SELECT queries in the SQL Console.
4. Once queries are executed, disable the plan trace.
a. Open the Trace Conguration dialog.
b. Select Stop Tracing and click Finish.
The plan trace editor opens displaying the list of traced queries.
5. Optional: Double-click a traced query to visualize its execution plan.
SAP HANA Troubleshooting and Performance Analysis Guide
Tools and Tracing
PUBLIC 265
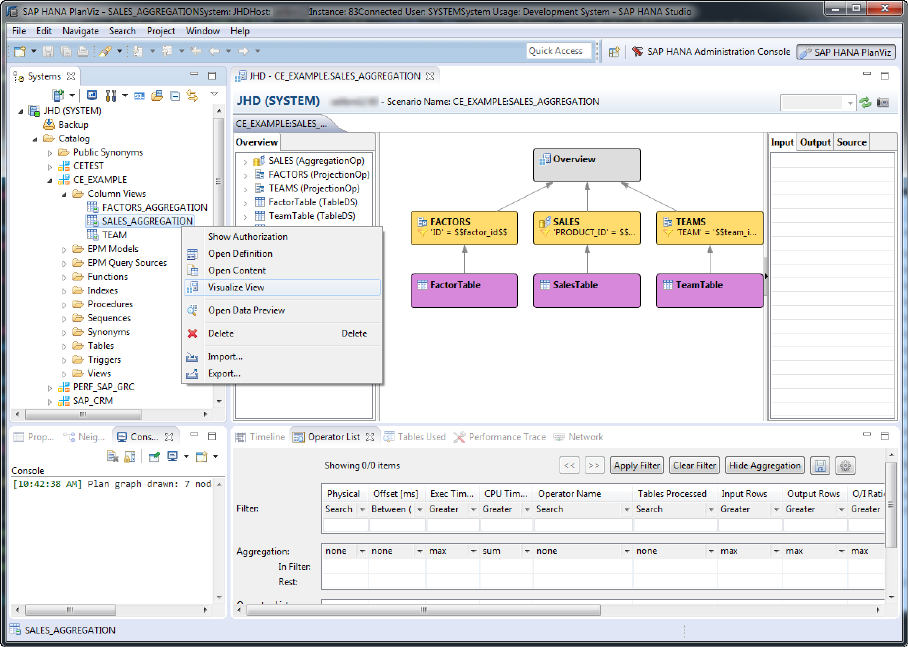
4.3.2.9 Calculation Scenario Visualization
By navigating to a particular calculation view in the Systems view, you can access the Visualize View context
menu, which will visualize the calculation scenario associated with the view.
The calculation scenario visualizer consists of following three main sections:
• left: an overview which provides a list of calculation nodes involved in the scenario with their main
properties
• middle: the visualized graph of calculation scenario
• right: an input tab which provides mapping information of the selected node, an output tab which provides
attributes of a selected node, and a source tab which shows the raw JSON data of the selected node
The visualizer supports:
• link with 'Properties' view for each selected node
• double-clicking on a particular data source to drill down to its calculation scenario
You may use this visualizer to check whether the scenario is designed according to your understanding, and, if
not, nd potential tweaking points.
266
PUBLIC
SAP HANA Troubleshooting and Performance Analysis Guide
Tools and Tracing
4.4 Result Cache
The static result cache and the dynamic result cache are congurable applications of caching query results to
gain performance benets.
Caching is used widely in SAP HANA as a strategy to improve performance by re-using queried data rather
than re-reading and processing the data every time it is requested. The static result cache (sometimes referred
to as cached views) and the dynamic result cache are applications of this. The static result cache is created for
a specic view and remains valid for the duration of a user-dened retention period. The dynamic result cache
is similar but does not have a retention period; it guarantees transactional consistency by maintaining delta
records of all changes applied to the underlying table.
The following table gives a comparative overview of essential details of the static and dynamic result cache
features, these are described in detail in the subsections which follow:
Feature Static Result Cache Dynamic Result Cache
Target Scenario Scalability enhancement for query on complex
view (usually top-level view) from an
application which can accept stale data.
Scalability enhancement for heavy aggregation
workload on big tables which are frequently
updated (for example ACDOCA).
Query result Stale data Non-Stale data
Scope Target objects: SQL View, User-dened table
function (w/o imperative logic), Calculation
view with some limitation.
Aggregation types: SUM, MIN, MAX, COUNT.
Target objects: SQL Views on the aggregation
of a single column table.
Aggregation types:
SUM, COUNT, AVG - fully supported.
MIN, MAX- partially supported for insert only
table.
Cache Maintenance
Whenever the cache period becomes older
than the retention period then the cache is fully
refreshed.
At each query execution:
-If updated records are identiable then the
cache is incrementally updated with updated
records.
-If no update is identiable (due to MVCC
garbage collection) then the cache is fully
refreshed.
Implicit view matching Not supported Supported with hint / conguration.
Adoption eort:
dening cache
Usually static result cache is enabled on
existing CDS view or calculation view.
In the case of a CDS view without aggregation
the result cache should be dened with
expected aggregation type from target queries.
If the target aggregation is already dened as
a view, dynamic result can be enabled on the
existing view (explicit usage).
Otherwise, a new view denition is required and
dynamic result cache can be used with implicit
view matching.
SAP HANA Troubleshooting and Performance Analysis Guide
Tools and Tracing
PUBLIC 267

Feature Static Result Cache Dynamic Result Cache
Adoption eort:
enable cache
utilization
A hint is required to exploit static result cache
to make user intention on stale data access
clear.
Dynamic result cache is utilized by default even
without a hint (but hint or conguration is
required for enabling implicit view matching in
the current release.)
4.4.1Static Result Cache
Complex SQL views and calculation views place a heavy load on the system. You may be able to use the static
result cache to reduce CPU consumption (and thus to increase overall system throughput) or to reduce the
response time of queries.
Frequently accessed views may consume an excessive amount of CPU. Cached views can trade this CPU
consumption for an increased memory consumption by caching the result of evaluating a view and reusing this
cached data when the view is accessed by a query.
Using the static result cache the query result of a view is cached in memory and refreshed only periodically. On
the one hand, this avoids having to reevaluate the view each time the view is accessed, on the other hand, the
cached data might be stale if the tables used by the view are updated after the last refresh. However, the data
retention period which determines how old the data may become is congurable and the age of the cached
data is also returned to the database client.
Cached views must be implemented in combination with careful testing to validate that correct results are
returned, that the cached views are actually used, and that indeed the CPU consumption is reduced. Tools
which can help with this are available in SAP HANA cockpit and SAP HANA studio such as Explain Plan and
Visualize Plan (see separate sections of this document).
Scope
Generally, caching can be used for calculation views, SQL views, table functions which return the result of a
single SQL SELECT statement, and CDS views (which are translated into table functions). To save memory,
cached views store aggregated values (aggregation types SUM, MIN, MAX, and COUNT are supported).
Not all views may be suitable for caching (for example views using time functions which depend upon the
current time would not be suitable). Caching cannot be used for scripted views, join views, OLAP views, and
hierarchy views. Other limitations may apply, for example, if analytic privileges have been applied to the data.
Conguring the Memory Budget
A maximum cache size (a memory budget) must be dened to manage the maximum amount of memory
available to cache cached views. This is congured in the indexserver.ini le in the total_size parameter in
the result_cache section of the le.
268
PUBLIC
SAP HANA Troubleshooting and Performance Analysis Guide
Tools and Tracing

Parameter Default Detail
total_size 10000 The memory budget in MB available for cached views.
If the memory consumed for caching views exceeds this threshold an alert is raised and, where necessary,
cached views will be dropped from memory resulting in higher response times for previously cached data.
In this case administrators may increase the memory budget size or create capacity in the budget by, for
example, dropping cached views which are rarely used.
If a view fails to be created then it is added to an exclusion list of views which have not been successfully
cached (view M_RESULT_CACHE_EXCLUSIONS). There are two common cases where this occurs:
• If the time to calculate the result of the view is longer than the retention time.
• If the memory required to cache the result of the view is larger than the memory budget.
The following example query selects basic details of failed cached views:
SELECT SCHEMA_NAME, OBJECT_NAME, REASON, EXCLUDE_TIME
FROM M_RESULT_CACHE_EXCLUSIONS
Hints to Enable the Result Cache
The static result cache feature is disabled by default and is only considered when explicitly invoked by using
one of the following RESULT_CACHE hints in the SQL statement :
Parameter
Detail
HINT(RESULT_CACHE)
Always use the result cache if it is available.
HINT(RESULT_CACHE_MAX_LAG(
seconds))
Sets the retention period of the result cache to this value (or the value set in the
ADD CACHE conguration).
HINT(RESULT_CACHE_NON_TRAN
SACTIONAL)
Allows join or union operations using the result cache entries and disregards
possible transaction inconsistencies.
HINT(RESULT_CACHE_NO_REFRE
SH)
Access existing cached data without refreshing it even if its retention period is
over.
Note that the hint class for result cache is also supported: RESULT_LAG('result_cache'[, seconds])
4.4.1.1 Creating and Using the Static Result Cache
This topic gives a number of examples to illustrate how you can use the result cache.
To save memory cached SQL views are based on aggregated results (SUM, MIN, MAX and COUNT are
supported); only the aggregated values are stored. The SQL optimizer uses the aggregation type of each
column in the top-most select statement as the basis for the cached result.
SAP HANA Troubleshooting and Performance Analysis Guide
Tools and Tracing
PUBLIC 269

When a user submits a query to a cached view a matching process analyzes the request and the denition of
the query to see if the cached data can be used or if the request must read the data from the database.
To exploit the cached data the query must match with the denition of the result cache and a number of
matching rules apply:
• The query must reference the same columns (or a subset of the columns) in the cache.
• The query must explicitly reference the view or a sub view referenced by the view.
• The predicate in the query must be the same as that used in creating the view, any additional conditions
which are added must be more restrictive lters.
Examples
Aggregation (OF clause)
For SQL views / functions, you can explicitly state the aggregation type as part of the ADD cache clause, then
the cache will be dened with an additional aggregation operation on the top for the view denition. This is
shown in the following example which creates a view and then uses the alter view syntax to add the view to the
cache with a retention period of 120 minutes.
CREATE VIEW SIMPLE_VIEW AS
(SELECT A, SUM(KF1) AS KF1, MIN(KF2) AS KF2, MAX(KF3) AS KF3
FROM SIMPLE_TABLE GROUP BY A)
ALTER VIEW SIMPLE_VIEW ADD CACHE RETENTION 120 OF A, SUM(KF1), MIN(KF2),
MAX(KF3);
The cache contents will be created from the result of the query: SELECT A, SUM(KF1), MIN(KF2),
MAX(KF3) FROM SIMPLE_VIEW GROUP BY A;
In the following example queries, the rst two statements consistently use the same aggregated values as
dened in the query and can exploit the cache. The third example cannot use the cached data because it
requests unaggregated details which are not included in the cache:
SELECT SUM(KF1) FROM SIMPLE_VIEW WITH HINT(RESULT_CACHE);
SELECT SUM(KF1), MIN(KF2), MAX(KF3) FROM SIMPLE_VIEW GROUP BY A WITH
HINT(RESULT_CACHE);
/* only aggregated data is cached - cannot use the cached data*/
SELECT KF1, KF2, KF3 FROM SIMPLE_VIEW WITH HINT(RESULT_CACHE);
If the user does not state the aggregation option in the ALTER VIEW statement, the cache will be dened the
same as the view denition:
ALTER VIEW SIMPLE_VIEW ADD CACHE RETENTION 120;
In this case, the cache contents will be created from result of the query: SELECT * FROM SIMPLE_VIEW;.
There is then no limitation of cache utilization for queries on SIMPLE_VIEW (as long as RESULT_CACHE hint is
used) and the cache would be utilized for all of above three queries.
270
PUBLIC
SAP HANA Troubleshooting and Performance Analysis Guide
Tools and Tracing

Filters (FILTER clause)
This example illustrates ltering. If the user states the additional lter option, the cache will be dened with an
additional lter on the top of the view denition:
ALTER VIEW SIMPLE_VIEW ADD CACHE RETENTION 120 FILTER B > 3;
The cache contents will be created from the result of the query: SELECT * FROM SIMPLE_VIEW WHERE B >
3;
In the following example queries the rst two statements will exploit the cache as those queries requires cache
data (B > 3) only. The third example cannot use the cached data because the query requests data which is not
a part of cached data.
SELECT SUM(KF1) FROM SIMPLE_VIEW WHERE B > 3 AND B < 10 WITH HINT(RESULT_CACHE);
SELECT SUM(KF1) FROM SIMPLE_VIEW WHERE B > 3 AND A = 1 WITH HINT(RESULT_CACHE);
/* only B > 3 data is cached - cannot use the cached data*/
SELECT KF1, KF2, KF3 FROM SIMPLE_VIEW WHERE A = 1 WITH HINT(RESULT_CACHE);
Cached Views and Analytic Privileges
By default a cache entry is created for each analytic privilege which in some cases may lead to a
large number of cache entries. To avoid this situation and to provide some exibility an alternative
scheme is available which can be applied by either setting a conguration parameter or using the hint
HINT(RESULT_CACHE_BEFORE_ANALYTIC_PRIVILEGE). With this option one cache entry is created without
applying analytic privileges and the privilege is then applied on top of the cache for every query execution
and the coverage of analytic privilege type is also changed. By default, only static XML analytic privileges are
supported, but using the conguration parameter or hint this limitation is removed and dynamic XML analytic
privileges and SQL analytic privileges are also supported.
This feature can be enabled using the following conguration setting in the [result_cache] section of the
indexserver.ini le:
Parameter
Default Detail
before_analytic_privilege False
Set this to True to enable the option of caching the result before
applying analytic privileges.
The following hints are supported:
• HINT(RESULT_CACHE_BEFORE_ANALYTIC_PRIVILEGE) - this hint builds the cache before the
authorization restrictions are applied (that is, read all the data and apply the restrictions when the data is
queried so that only authorized data is selected for each user).
• HINT(RESULT_CACHE_AFTER_ANALYTIC_PRIVILEGE)- this hint builds the cache in the normal way by
applying analytic privileges rst. This option is more ecient in terms of memory usage since less data is
cached but is only suitable for views where static XML privileges have been applied.
SAP HANA Troubleshooting and Performance Analysis Guide
Tools and Tracing
PUBLIC 271

Result Cache HDI Plugin
To transform and deploy design time DDL-based result cache denitions the result cache plugin is available.
The following example denes a result cache for the view named 'A_Sql_View':
RESULT CACHE "_SYS_CACHE#sap::A_Sql_View" ON VIEW "sap::A_Sql_View" WITH
RETENTION 30
This DDL-style syntax is the same as SQL except that no CREATE / ADD keyword is required. The complete
name of the cache is specied as: "_SYS_CACHE#<view name>".
To cache a table function use ON FUNCTION instead of ON VIEW. Any values after the keyword WITH are
copied to the corresponding SQL statement, so other parameters such as dening a projection list, a lter or
the force ag are also supported.
Refer to the SAP HANA Developer Guide For SAP HANA XS Advanced Model for further details.
4.4.1.2 Resources for Testing the Result Cache
This topic uses an example calculation view to illustrate how you can work with tools to test the result cache.
After caching a view it is important to verify that the view has been successfully cached, that correct results
are returned, that the cached views is actually used and is eectively reducing CPU consumption. The following
example uses the ALTER VIEW syntax to add a calculation view result to the cache with a retention period of 60
minutes:
ALTER VIEW "_SYS_BIC"."sap.hba.ecc/CostCenterPlanActualCommitmentQuery" ADD
CACHE RETENTION 60;
Note that the top-most node of a calculation view should be an aggregation type node. If it is not but the
calculation view does implicit grouping then caching will fail.
Carry out the following checks:
1) Check the system view RESULT_CACHE:
select schema_name, object_name, cache_type
from RESULT_CACHE
where object_name = 'my_view';
If the query on system view RESULT_CACHE returns a record, it indicates the successful creation of the cached
view.
2) After running a query against the cached view, use the Explain Plan tool (context menu in the SQL Console)
to conrm the source of the query result. The OPERATOR_NAME value should show RESULT_CACHE.
3) Continue to test the cached view by monitoring the execution times of queries based on the view. Expect the
rst execution of the query to be slow and look for performance improvements on subsequent runs. If there is
no reduction in response time or CPU consumption when the cached view is used then it is not benecial.
4) Use monitoring views M_RESULT_CACHE and M_HEAP_MEMORY to see more details of the cached view
such as memory consumption and data refresh details.
272
PUBLIC
SAP HANA Troubleshooting and Performance Analysis Guide
Tools and Tracing

Related Information
Analyzing SQL Execution with the Plan Explanation [page 248]
4.4.2Dynamic Result Cache
The dynamic result cache may be used to improve the performance of queries which are frequently executed.
In comparison to the static result cache, running queries against a dynamic result cache may be a better option
for increasing the performance of queries. The dynamic result cache oers improved throughput and response
time but most importantly it eliminates the risk of querying stale data and will always return transactionally
consistent data. However, dynamic caches are not suitable for all views, the performance gains depend very
much upon the nature of the data, the query, and how frequently the cache is read.
Optimal scenarios where the dynamic result cache can dramatically improve performance include the following
characteristics:
• Intensive parallel querying of large tables
• Extensive use of aggregation
• Tables are regularly updated and up-to-date query results are essential.
An SAP Note about the Dynamic Result Cache is available: SAP Note 2506811 - FAQ: SAP HANA Dynamic
Result Cache.
Overview
You specify the cache type when you create the cache; only one type of cache can be applied to a view, either
static or dynamic. A key dierence is that the dynamic result cache has no retention period:
ALTER VIEW V ADD STATIC CACHE RETENTION 10;
ALTER VIEW V ADD DYNAMIC CACHE;
Dynamic result caches require no retention period because up-to-date query results are guaranteed. When a
query is executed against a dynamic result cache there are two possible responses:
• In the best-case scenario up-to-date results are returned by rstly incrementally updating the cache with
delta records of newly inserted, updated or deleted data and then returning the query result from the
cache.
• In some situations an incremental update of the cache is no longer possible as delta records are not
identiable due to version garbage collection; in this case the 'fallback' option is then invoked and the query
runs against the database. A full refresh of the cache is then executed in the background in a separate
thread.
SAP HANA Troubleshooting and Performance Analysis Guide
Tools and Tracing
PUBLIC 273
The decision to either read from the cache or the database is taken during execution of the query. Events which
invalidate and prevent use of the cache include the following:
• The cached data has been invalidated by garbage collection (see details below).
• The volume of delta records has reached its maximum permitted size of 10,000,000 (planned to be
changed in a future release).
In any of these cases the fallback option is used instead of the cache.
Scope
Dynamic result caches are only supported for SQL views dened as aggregation on single column tables;
aggregation types sum, count, and avg are supported. MIN and MAX aggregation is partially supported for
INSERT (see below).
Benets and Limitations
Some of the factors inuencing the benets gained from using dynamic result cache are discussed in more
detail here:
Query Execution Frequency: A side-eect of the version garbage collection process is that it may clear data
from the cache. To a certain extent the frequency of the garbage collection can be controlled by setting the
blocking period (see conguration below), but you should consider the negative impact this will have on the
general performance of all SELECT and UPDATE statements accessing the target table. If the cache is not
used within the blocking period then the cache will be invalidated by garbage collection and must be refreshed.
A querying frequency against the cached view of less than the garbage collection blocking period (default 1
minute) is therefore essential.
Table Size and Cache Size: Performance of the dynamic result cache is proportional to the cache size. A
performance gain can only be expected if the dynamic result cache has a signicantly smaller cache size than
the base table.
Aggregation: One of the greatest benets of cached views is in reducing the need for expensive aggregation
processes. If your data has a high degree of aggregation then using cached views may be benecial. Queries
with highly-selective lters, on the other hand, requiring only a few milliseconds for aggregation processing
should expect no benet from using dynamic result cache.
Base Table Characteristics: If the base table of the view is mostly used to INSERT data then a dynamic
result cache can be dened eectively in combination with all supported aggregation types: SUM, COUNT,
AVG, MIN, MAX. However, DELETE and UPDATE operations on the base table in combination with MIN or
MAX aggregation invalidate the cache and reduce the potential performance improvement. It is therefore not
recommended to use dynamic result cache with MIN/MAX aggregation if the target table is not an INSERT only
table.
274
PUBLIC
SAP HANA Troubleshooting and Performance Analysis Guide
Tools and Tracing

Related Information
SAP Note 2506811
4.4.2.1 Working With The Dynamic Result Cache
This section includes examples of creating the cache and the conguration parameters available to modify the
operation of caches and monitoring usage.
SQL Syntax
The OPTIMIZER ADMIN privilege is required to execute commands to congure the dynamic result cache.
You can add a dynamic cache to a view using either the CREATE VIEW or ALTER VIEW statements. Optionally, a
lter condition can be applied to the view. The basic syntax is shown here:
CREATE VIEW <view_name> [(column_name_list)] AS <subquery>
WITH DYNAMIC CACHE [FILTER <filter_condition>];
The option to DROP a cache is also available. Commands for use with ALTER SYSTEM are:
• CLEAR (remove all cache entries)
• REMOVE (remove a single named cache entry)
Refer to the SAP HANA SQL and System Views Reference for full details.
Examples
The basic usage with ALTER VIEW is shown in this example:
ALTER VIEW MyView ADD DYNAMIC CACHE;
To create a view with a dynamic result cache the syntax is:
CREATE VIEW MyView as (…) WITH DYNAMIC CACHE;
The following examples show how the dynamic result cache is used when a lter condition is applied:
1. You can apply a lter using the parameterized lter condition (with a question mark):
ALTER VIEW view1 ADD DYNAMIC CACHE FILTER MANDT = ?;
Only the equals comparator is permitted but multiple conditions can be used with the AND operator. For
example: MANDT = ? AND RLDNR = ?
2. If the cache is dened with a lter then a condition must be applied in the query:
SELECT * FROM view1 WHERE MANDT = 300;
SAP HANA Troubleshooting and Performance Analysis Guide
Tools and Tracing
PUBLIC 275
3. The lter value can also be provided as a runtime parameter using the question mark syntax:
SELECT * FROM view1 WHERE MANDT = ?;
Conguration
Dynamic result caches are enabled by default. A number of conguration parameters are available to manage
this feature in the 'dynamic_result_cache' section of the ini le:
Parameter: enabled
Purpose
Enable the dynamic cached views feature. If this is set as false then any cached data will be
ignored.
Default
true
Additional information
This functionality is available at run-time using the following two hints:
DYNAMIC_RESULT_CACHE - Select data from the dynamic result cache
NO_DYNAMIC_RESULT_CACHE - Explicit instruction not to use the cache
Parameter: total_size
Purpose
Apply a memory budget, that is, the maximum memory allocation which is available for all
dynamic result cache entries.
Default
10000
Unit
MB
Parameter: max_cache_entry_size
Purpose
Apply a memory budget for individual cache entries, that is, the maximum memory allocation
which is available for a single dynamic result cache.
Default
1000
Unit
MB
Exceptions Caches which exceed this size limitation are not used, they are registered on the
exclusion list and the fallback query will be used in future. The monitoring view
M_DYNAMIC_RESULT_CACHE_EXCLUSIONS shows a single entry for each cache which has
been excluded.
Note that for caches where a lter has been applied exclusion depends on the parameter used
and the total size of the result. If the result using one parameter is excluded it may still be
possible to use the cache with a dierent parameter which returns results within the memory
budget.
276 PUBLIC
SAP HANA Troubleshooting and Performance Analysis Guide
Tools and Tracing
Parameter: max_cache_entry_size
You can remove a cache key from the exclusion list by any of the following:
1. Disable dynamic result cache on the view: ALTER VIEW … DROP DYNAMIC CACHE;
2. Drop the view: DROP VIEW...;
3. Use the clear command: ALTER SYSTEM CLEAR DYNAMIC RESULT CACHE;
Parameter: version_garbage_collection_blocking_period
Purpose
This parameter is used to prevent garbage collection from running against the view's base table.
Default
60
Unit
Seconds
Additional information
A side-eect of the version garbage collection process is that it may invalidate the cache which
must then be refreshed. To prevent this from frequently happening, you can use this parameter
to control the garbage collection process of the base table to block garbage collection for a
limited period of time.
Note that if the cache is not used within this period it will be invalidated and must be refreshed.
Parameter: enable_auto_delta_refresh
Purpose
Controls automatic delta refresh of dynamic result cache. Use this feature to minimize the
possibility of cache invalidation by garbage collection. If this is turned on a background job
triggers a refresh of the cache entry's delta whenever it is required. The feature is turned o by
default.
Default
FALSE
Parameter: enable_implicit_match
Purpose
Controls implicit matching which automatically attempts to match queries with the dynamic
result cache. The feature is enabled by default.
Default
TRUE
Monitoring
Two views are available to analyze the operation of the cache:
M_DYNAMIC_RESULT_CACHE Every cache has its own ID and this view gives full details of each cache
including memory size, record count and timestamps for cache and delta store. It also includes the timestamp
of the last cached MVCC snapshot which is the basis of the garbage collection process.
This view only shows data for a cache once a query has been executed against the view.
M_DYNAMIC_RESULT_CACHE_EXCLUSIONS Usage of views which cannot be cached is logged and details
can be seen in this view. Typically, this is caused by a data selection which exceeds the size dened in
SAP HANA Troubleshooting and Performance Analysis Guide
Tools and Tracing
PUBLIC 277
max_cache_entry_size (by default 1GB). This view includes memory size, record count and timestamp of the
data.
Implicit Matching
In order to extend the usage of the dynamic result cache to other queries, implicit matching automatically
attempts to match queries with cached views.
Using implicit matching the SQL optimizer reads the query plan of the current statement and analyzes the
structure to check if the requested data can be retrieved from cached data. If a suitable cache is available and
all the checks for data compatibility and user privileges are successful then the SQL optimizer rewrites the
execution plan to utilize the existing dynamic result cache.
Implicit matching may incur a slight overhead in query compilation times and although the feature is enabled
by default it can be turned o by setting the conguration parameter enable_implicit_match to FALSE.
Hints for Enabling Implicit Matching
If implicit view matching is disabled it can be used on an ad hoc basis using the following hint:
DYNAMIC_RESULT_CACHE_IMPLICIT_MATCH
Or, conversely, use this hint if necessary to manually turn it o:
NO_DYNAMIC_RESULT_CACHE_IMPLICIT_MATCH
Optionally, implicit matching can be used with a named specic view, or a selection of preferred views:
DYNAMIC_RESULT_CACHE_IMPLICIT_MATCH(<schema_name1>.<view_name1>,
<schema_name2>.<view_name2>, ...)
4.4.2.2 Testing the Dynamic Result Cache
You will need to test queries using a dynamic result cache to verify the performance benet. Some general
guidance to support testing is given here.
Testing and Verication
Important resources for testing include Explain Plan and Plan Visualization, and the monitoring view
M_DYNAMIC_RESULT_CACHE. You should be able to step through the complete process of creating and
querying the view and measuring the performance. This may include the following actions:
• Building and querying the cache
• Updating the target table and seeing an increase in the delta record count
• Seeing the selection of the appropriate query plan (both reading from the cache and reading from the
database) using Plan Visualization.
278
PUBLIC
SAP HANA Troubleshooting and Performance Analysis Guide
Tools and Tracing
• Testing the eects of version garbage collection.
• Measuring performance (using hints to turn cache usage on or o).
Create and Verify the View and Cache
Create the view and user ALTER VIEW to add the dynamic cache. You can then conrm that the cached view
was created by checking the system view DYNAMIC_RESULT_CACHE:
select
schema_name, object_name, cache_type, cache_filter, cache_locations
from DYNAMIC_RESULT_CACHE;
The expected return values are as follows:
CACHE_TYPE 'DYNAMIC, FULL' (for a dynamic result cache without a lter) or
'DYNAMIC, PARTIAL' (for a cache with a lter).
CACHE_FILTER
Filter shown if specied.
CACHE_LOCATIONS
Location of cache entry if specied.
Verify the Query Plan
Run a test query against the cached view. You can now use Explain Plan (either within SAP HANA Studio or
from the SQL command line) to verify that the query plan for a dynamic cached view has been created. In the
output, search for the operator name property HAVING - DYNAMIC VIEW CACHE. This is only created when the
dynamic result cache is active.
For further testing, note that if implicit matching was used using the hint
DYNAMIC_RESULT_CACHE_IMPLICIT_MATCH the operator name CONTROL SWITCH will include "AUTO VIEW
MATCH" details as one of its properties.
Build and Monitor the Cache
The cache is built for the rst time when you rst run the query.
Firstly, you can use the Visualize Plan tool to see which alternative plans are built for the query and which one is
executed. Note also the detailed execution times in the tool.
Secondly, you can see full details of the cache refresh process in the monitoring view
M_DYNAMIC_RESULT_CACHE. Select all details for the view:
select * from m_dynamic_result_cache where object_name = 'MyView';
Key values include: Refresh reason (initially 'Cache Creation'), Duration, State, Refresh_Count, Memory_Size,
Record_Count.
Measure the Delta Record Count After Updates
After executing some INSERT operations in the target table you can monitor how the cache is used in this
situation.
1. Use Visualize Plan to see which plan is executed. Check the row count numbers to see the eects of adding
new data to the table.
2. In the M_DYNAMIC_RESULT_CACHE view, the Delta_Refresh_Count shows an increase in how often delta
records have been added to the cache.
SAP HANA Troubleshooting and Performance Analysis Guide
Tools and Tracing
PUBLIC 279

Monitor Version Garbage Collection
Verify the eects of garbage collection by holding queries back for one minute until after the garbage collection
process has run.
In the M_DYNAMIC_RESULT_CACHE view, check the value of the last refresh reason time. This will show
'MVCC_GARBAGE_COLLECTION'.
Test Implicit Matching
To test Implicit Matching you can use the Explain Plan tool in SAP HANA Studio to analyze the details of the
execution and optimization processes. You can see which views have been considered by the optimization
process by looking at the result value returned by the following procedure:
GET_DYNAMIC_RESULT_CACHE_IMPLICIT_MATCH_CANDIDATES_IN_STATEMENT
The views that passed the checking phase, but were not selected in the rewriting phase of the process will
be marked as 'CANDIDATE MATCH'. Explain Plan will show the rewritten plan with the selected view name
replacing the original table(s) specied in the statement.
4.5 Advanced Analysis
If have you an advanced knowledge of SAP HANA and SQL databases and you suspect that automated
processes are making poor decisions that have negative impacts on query performance, you can perform
advanced analyses to better understand how those decisions were made.
In SAP HANA cockpit you can use specic tracing features to generate detailed trace information to help
analyze the following processes:
• Table joins using the join evaluation (je) trace
• Column searches using the query optimizer (qo) trace
Recommendation
Perform these types of analysis only if analyses of query plans and SQL statements were not enough to nd
the root cause of slow query performance.
Exporting SQL Plans
In the SAP HANA backend, the SQL Query Processor parses the SQL query statements and generates
optimized SQL Query Execution plans. As the Query Processor and the Query Optimizer continue to be
developed the resultant execution plans for a given query may change. All developments are of course intended
to improve performance but if you suspect that performance of a query might be worse after an upgrade, the
Abstract SQL Plan feature makes it possible to export an abstracted version of an execution plan and reuse it in
a dierent target system.
280
PUBLIC
SAP HANA Troubleshooting and Performance Analysis Guide
Tools and Tracing
4.5.1Analyzing Column Searches (qo trace)
In SAP HANA, if a column search takes a long time, you can analyze how the query-optimizer performed the
column search. A query-optimizer (qo) trace of a single SAP HANA table search provides the details you need
for such an analysis.
Context
The qo trace provides a lot of detailed information that is hard to analyze if you are not an SAP HANA query-
optimizer expert; however, it provides very useful information for performance analysis. From the information
within the trace les, you can see which column the query-optimizer decided to use as the rst column in
the column search and you can determine whether that decision negatively impacted the performance of the
column search.
To start a user-specic qo trace in SAP HANA cockpit and analyze the relevant trace information, proceed as
follows.
Procedure
1. In SAP HANA Database Explorer choose Trace Conguration from the database context menu and create a
new user-specic trace.
The Trace Conguration dialog box opens.
2. Specify a context name.
The context name appears as part of the trace le name and should be easy for you to recognize and later
nd.
3. Specify your database user or application user.
4. Enter qo as lter text and search for the trex_qo component.
5. For the trex_qo component, select DEBUG as the system trace level.
6. Choose OK.
7. Run the query you want to trace.
8. Switch o the trace by deleting the user-specic trace conguration.
9. Search through the Database Diagnostic Files folder and locate the trace le. The le opens on a new tab
page.
10. In the trace section, analyze the trace information for each term (WHERE condition).
a. Find the sections detailing the estimated results for the terms.
These sections are marked with GetEstimation.cpp.
b. Find the sections detailing the actual search results for the terms.
These sections are marked with Evaluate.cpp.
c. Compare the estimated results with the actual search results.
The query-optimizer selects which column to use as the rst column of the search based on the term
with the lowest estimated number of results.
SAP HANA Troubleshooting and Performance Analysis Guide
Tools and Tracing
PUBLIC 281
Results
If the actual results indicate that a dierent term should have been used to start the column search, then this
may represent the source of poor performance. For more detailed analysis, you can send the trace le to SAP
Support.
4.5.2Analyzing Table Joins
In SAP HANA, if a query on joined tables takes a long time, you can analyze how the tables are joined and in
what order. A join evaluation (je) trace of joined SAP HANA tables provides the details you need for such an
analysis.
Context
The je trace provides a lot of detailed information that is hard to analyze if you are not an SAP HANA join engine
expert; however, it provides very useful information for performance analysis. From the information within the
trace les, you can see which table is used as the rst table when processing a join and how the order of
tables in the join is dened. You can use this information to determine whether query performance is negatively
impacted by the table join.
To start a je trace in SAP HANA cockpit and analyze the relevant trace information, proceed as follows:
Procedure
1. In SAP HANA Database Explorer choose Trace Conguration from the database context menu and create a
new user-specic trace.
The Trace Conguration dialog box opens.
2. Specify a context name.
The context name appears as part of the trace le name and should be easy for you to recognize and later
nd.
3. Specify your database user or application user.
4. Enter join as lter text and search for the join_eval component.
5. For the join_eval component, select DEBUG as the system trace level.
6. Choose OK.
7. Run the query you want to trace.
8. Switch o the trace by deleting the user-specic trace conguration.
9. Search through the Database Diagnostic Files folder and locate the trace le. The le opens on a new tab
page.
10. From the end of the le, search backwards for the beginning of the trace section.
The trace section starts with i TraceContext TraceContext.cpp.
282
PUBLIC
SAP HANA Troubleshooting and Performance Analysis Guide
Tools and Tracing

11. In the trace section, analyze the following trace information:
• Estimations for the WHERE conditions
• Table size and join conditions
• Join decision
4.5.3SQL Plan Stability
SQL Plan Stability can be used to guarantee the consistent optimal performance of select statements by
capturing query execution plans so that exactly the same plan can be reused when the query is executed again.
In SAP HANA, the SQL query processor parses SQL statements and generates SQL query execution plans.
As the query processor and the query optimizer continue to be developed (in, for example, the new HANA
Execution Engine - HEX) the resultant execution plans for a given query may change from one HANA release to
another, or the plan may change because the data being queried has been reorganized; it is therefore possible
that the performance of an SQL query statement may degrade.
In order to guarantee the performance of a query the plan stability feature oers the option to preserve a
query's execution plan by capturing an abstraction of the plan (ASP) and reusing it if required to regenerate the
original plan and restore the original performance.
Note
In some cases using statement hints may provide a solution to a loss of performance. Hints are available,
for example, to control which optimizing engine is used (Extended SQL Executor (ESX) or HANA Execution
Engine (HEX)); refer to Statement Performance Analysis for details.
Process Overview
Plan Stability is currently only eective for SELECT queries and can be used to capture abstract SQL plans
from queries which are either:
• executed at the command line
• already stored in the plan cache.
Restrictions related to Plan Stability are documented in SAP Note 2639193: SAP HANA SQL Plan Stability.
Plan Stability requires the OPTIMIZER_ADMIN privilege. A two-stage process (capture and regenerate from
captured plans) is used based on the following SQL statements:
• Start / stop CAPTURE (optionally, capture cached statements)
• Start / stop APPLY, that is, start the process of matching executed queries with captured abstract plans.
Abstract SQL plans are visible in view ABSTRACT_SQL_PLANS and cached plans can be queried in
M_SQL_PLAN_CACHE_. The plan cache includes a value COMPILATION_OPTIONS which indicates what type
of plan was used (either normal query optimizer or abstract SQL plan) to create the cached statement. By
referring to these two views you can follow the stages of the capture and regeneration process and verify the
results of each step.
SQL statements are also available to enable, disable or remove abstract SQL plans from the
ABSTRACT_SQL_PLANS table.
SAP HANA Troubleshooting and Performance Analysis Guide
Tools and Tracing
PUBLIC 283

Usage Scenarios
There are essentially two use cases for plan stability:
• Upgrade Scenario: Plan Stability can be used at the time of a system upgrade. In this case, plans are
captured before the upgrade and applied afterwards.
Note
The feature can be used in the case of an upgrade from SAP HANA 1 to SAP HANA 2: it is available
in SAP HANA 1.0 SPS 12 for capture purposes and from HANA 2.0 SPS01 for both capturing and
regenerating execution plans.
• Always On Scenario: Plan Stability can also be used in daily operations. This may be required due to
changes in data over time which may cause the query optimizer to propose dierent execution plans
which may have a negative impact on performance and memory consumption of a query. An additional
preparation step can be used to apply lters so that only specic queries are captured. In the background
execution statistics are recorded so that the performance of the query can be measured and the best
execution plan can be selected.
This section in this document gives an overview of the process with examples of the main SQL commands
used. Full details of the SQL commands are available in the SAP HANA SQL and System Views Reference Guide.
Applying Filters to the Capture Process
You can use ltering to limit the capture process to specic targets. You can lter either by user name or by
setting a value for one of the workload class mapping properties listed below. Filtering by user name is done
at run time as the capture process is initiated (an example is given below), but to lter by workload class
property the lters must be set in advance so that they apply permanently; they can be removed when no
longer required.
The supported mapping property-value pairs that an application can set in the client interface are:
• APPLICATION USER NAME
• APPLICATION NAME
• USER NAME
• SCHEMA
• XS APPLICATION USER NAME
See also 'Properties for Workload Classes and Mappings' in the SAP HANA Administration Guide
Filters which have been applied can be seen in the _SYS_PLAN_STABILITY view, they are shown in JSON
format in the FILTERS column.
The following examples illustrate the basic syntax and usage of this feature:
Example
This example sets two lter conditions. The lters are applied when the capture process is run and captures
only plans for App2 where the application user name is 'Test':
ALTER SYSTEM ADD ABSTRACT SQL PLAN FILTER 'MyFilter01' SET 'application
name'='App2', 'application user name'='TEST’;
284
PUBLIC
SAP HANA Troubleshooting and Performance Analysis Guide
Tools and Tracing

The following example shows how a named lter can be removed; the keyword 'ALL' is also available to remove
all lters:
ALTER SYSTEM REMOVE ABSTRACT SQL PLAN FILTER 'MyFilter01';
Example
Queries are tested against all existing lters to nd a match. In the following example two lters have been
dened, if the conditions of the rst lter match with a query plan it will be captured, if not, the conditions of
the next lter will be tested:
ALTER SYSTEM ADD ABSTRACT SQL PLAN FILTER 'filter01' SET 'application name' in
[‘MyStudio’, ‘MyBiz’], 'application user name'='TEST’;
ALTER SYSTEM ADD ABSTRACT SQL PLAN FILTER 'filter02' SET 'User name'='SYSTEM'
'application name'='MyShop' 'application user name'='Employee25’, 'Employee26’;
This means Plan Stability will capture only queries with application properties where:
Application name is "MyStudio" OR "MyBiz" AND application user name is "TEST"
OR
User name is "SYSTEM" AND application name is "MyShop" AND application user name is "Employee25" OR
"Employee26".
Using Plan Stability
Capture
The capture process must be explicitly started and stopped manually.
SQL lter keywords are available to restrict the capture to individual users; this example starts the capture
process for queries submitted by two named users:
ALTER SYSTEM START CAPTURE ABSTRACT SQL PLAN FOR USER TESTUSER1, TESTUSER2;
The capture process runs in the background while selected queries are executed. During the capture period an
abstract plan will be created for any newly submitted queries. The abstracted plan is in JSON format, it is not
a complete plan but contains logical plans and essential properties such as join algorithms and table locations.
The view M_ABSTRACT_SQL_PLAN_OVERVIEW shows high-level details of activity related to abstract plans
for each instance of host and port, this includes current state (ready, capture, apply), the number of plans,
memory consumption and timestamps of the last capture period (start/stop time).
Once all required queries are captured, stop the capture process by executing the CAPTURE command
again with the keyword STOP. Verify that the abstract plans have been created by referring to system view
ABSTRACT_SQL_PLANS. This view shows key details including the following:
SAP HANA Troubleshooting and Performance Analysis Guide
Tools and Tracing
PUBLIC 285

Key Values in ABSTRACT_SQL_PLANS
Column Example / Detail
ABSTRACT_SQL_PLAN_ID 10003, 20003 etc.
HOST, PORT Abstract plans are saved on the basis of locations (host and port). These details
can be updated using the SQL statement UPDATE ABSTRACT SQL PLAN.
STATEMENT_STRING SQL SELECT statement.
PLAN_KEY Text string.
ABSTRACT_SQL_PLAN JSON formatted string.
IS_ENABLED Abstract plans can be enabled or disabled as required - see below.
IS_VALID If FALSE the captured plan cannot be used - see validity details below.
The following example uses the JSON_VALUE() function to select abstract plans for a given schema (the
variable $.session_user could be used to select plans for a given user):
SELECT * FROM ABSTRACT_SQL_PLANS WHERE JSON_VALUE(PLAN_KEY, '$.schema') =
'mySchema';
Capture WITH CACHE Option
An additional option is available to capture an abstraction of plans which are already cached. For this, the
keywords WITH SQL PLAN CACHE are required with the START statement:
ALTER SYSTEM START CAPTURE ABSTRACT SQL PLAN WITH SQL PLAN CACHE;
This triggers a job (JOB_NAME Plan Stability) which runs and stops when complete. You can monitor its
progress in view M_JOB_PROGRESS. On completion you can verify that abstract plans have been stored in
ABSTRACT_SQL_PLANS using the select statement given in the example above.
Regenerating Plans (Apply)
To apply the abstract SQL plans run the START APPLY statement:
ALTER SYSTEM START APPLY ABSTRACT SQL PLAN;
Now any newly compiled SELECT queries are matched where possible with captured abstract SQL plans and
the stored abstract plans are used to generate an execution plan. You can stop the apply period with the STOP
APPLY statement.
Verication: In the plan cache you can see the source of a cached statement by referring to the
COMPILATION_OPTIONS value, this will be either empty (compiled by HANA SQL query optimizer) or
'ABSTRACT SQL PLAN' to indicate that the plan was regenerated from an abstract plan.
Enabling and Disabling
Abstract SQL plans can be enabled, disabled or removed from the ABSTRACT_SQL_PLANS table by referring
to the ID value. You can enable plans either for the system as a whole or just for the current session. The
session-only option may be helpful to test the performance of a plan before enabling it for the system as a
whole (second example).
286
PUBLIC
SAP HANA Troubleshooting and Performance Analysis Guide
Tools and Tracing

The following example uses a list of plan IDs, the keyword ALL is also available to enable all plans (this sets
IS_ENABLED to true):
ALTER SYSTEM ENABLE ABSTRACT SQL PLAN ENTRY FOR MyPlanID01, MyPlanID02;
To enable a plan for the current session set the session variable ENABLE_ABSTRACT_SQL_PLAN_ENTRY value
to the plan ID:
SET 'ENABLE_ABSTRACT_SQL_PLAN_ENTRY' = 'MyPlanID01';
In this case, when the query for this plan is executed a comment is appended to the statement in the plan
cache identifying which plan was used, for example, the query SELECT * FROM T1 might be shown as follows:
SELECT * FROM T1 /* (session-wise plan stability) compiled_using_plan_id:
MyPlanID01 */;
If a plan is invalid (IS_VALID= FALSE) it will not be used even if it is selected; the query will be compiled using
the current version of the optimizer instead of the captured abstract plan. Reasons for invalidation include
failed checks on related objects and JSON deserialization failure. The reason is saved in the NOTES column of
the ABSTRACT_SQL_PLANS table.
The cache is automatically cleared in the background when certain events take place, that is, when the apply
phase is either started or stopped, when one or more plans are enabled or disabled or when one or more plans
are removed.
Changing Locations
If it is necessary to change the location details (host and port) of the server you can use the SQL statement
UPDATE ABSTRACT SQL PLAN. One scenario where this might be required is in high availability systems after
a failover when the secondary data center performs a takeover and becomes the production system. In this
case, it would be necessary to update the locations of all nodes. The following example illustrates a multi-node
scaleout scenario with two hosts, and uses the keyword ALL to update the location information of all plans:
ALTER SYSTEM UPDATE ABSTRACT SQL PLAN
SET LOCATION site1host1:30040 to site2host1:30040, site1host2:30040 to
site2host2:30040
FOR ALL;
Migrating Abstract SQL Plan After an Upgrade
When the system is upgraded, there might be changes to the internal structure of how the Abstract SQL Plan is
captured and stored. So, a migration is needed to the current structure after the upgrade. The migration can be
done using the following SQL statement:
ALTER SYSTEM MIGRATE ABSTRACT SQL PLAN;
Tracing
The trace level for this feature is congurable by setting a conguration parameter in the [trace] section of
the indexserver.ini le. The default value of the PlanStability parameter is 'error', set this to 'debug' if
necessary for detailed trace information.
SAP HANA Troubleshooting and Performance Analysis Guide
Tools and Tracing
PUBLIC 287

Related Information
Statement Performance Analysis [page 180]
M_ABSTRACT_SQL_PLAN_OVERVIEW System View
M_ABSTRACT_SQL_PLAN_STATISTICS System View
ALTER SYSTEM {START | STOP} APPLY ABSTRACT SQL PLAN (System Management)
Properties for Workload Classes and Mappings
SAP Note 2639193
4.6 Additional Analysis Tools for Support
To complement the standard tools for performance analysis, SAP HANA provides additional analysis tools that
SAP Support can use to help determine the cause of performance issues.
The following analysis tools are available in SAP HANA; however, these tools are intended only for use when
requested by SAP Support:
• Performance trace
This tool records performance indicators for individual query processing steps in database kernel.
• Kernel proler
This tool provides information about hotspots and expensive execution paths during query processing.
4.6.1Performance Trace
The performance trace is a performance tracing tool built into the SAP HANA database. It records performance
indicators for individual query processing steps in the database kernel. You may be requested by SAP Support
to provide a performance trace.
Information collected includes the processing time required in a particular step, the data size read and written,
network communication, and information specic to the operator or processing-step-specic (for example,
number of records used as input and output). The performance trace can be enabled in multiple tenant
databases at the same time to analyze cross-database queries.
Performance Trace Files
Performance trace results are saved to the trace les with le extension *.tpt or *.cpt, which you can access
with other diagnosis les. To analyze these les, you need a tool capable of reading the output format (*.tpt and
*.cpt). SAP Support has tools for evaluating performance traces.
288
PUBLIC
SAP HANA Troubleshooting and Performance Analysis Guide
Tools and Tracing
Enabling and Conguring the Performance Trace
You can enable and congure the performance trace in the SAP HANA studio or using the ALTER SYSTEM *
PERFTRACE SQL statements.
Example
To start the performance trace execute ALTER SYSTEM START PERFTRACE.
Conguration Options
Option
Description
Trace le name The name of the le to which the trace data is automatically saved after the performance
trace is stopped
User and application lters Filters to restrict the trace to a single specic database user, a single specic application
user, and a single specic application
Trace execution plans You can trace execution plans in addition to the default trace data.
Function proler The function proler is a very ne-grained performance tracing tool based on source code
instrumentation. It complements the performance trace by providing even more detailed
information about the individual processing steps that are done in the database kernel.
Duration How long you want tracing to run
If a certain scenario is to be traced, ensure that you enter a value greater than the time it
takes the scenario to run. If there is no specic scenario to trace but instead general system
performance, then enter a reasonable value. After the specied duration, the trace stops
automatically.
Additional lter options are available in extended mode to restrict the trace data further.
For more information about how to congure the performance trace using SQL, see the SAP HANA SQL and
System Views Reference.
Related Information
ALTER SYSTEM {START | STOP} PERFTRACE Statement (System Management)
ALTER SYSTEM SAVE PERFTRACE Statement (System Management)
ALTER SYSTEM LOAD PERFTRACE Statement (System Management)
M_PERFTRACE System View
SAP HANA Troubleshooting and Performance Analysis Guide
Tools and Tracing
PUBLIC 289
4.6.2Kernel Proler
The kernel proler is a sampling proler built into the SAP HANA database. It can be used to analyze
performance issues with systems on which third-party software cannot be installed, or parts of the database
that are not accessible by the performance trace. It is inactive by default.
The kernel prole collects, for example, information about frequent and/or expensive execution paths during
query processing.
It is recommended that you start kernel proler tracing immediately before you execute the statements you
want to analyze and stop it immediately after they have nished. This avoids the unnecessary recording of
irrelevant statements. It is also advisable as this kind of tracing can negatively impact performance.
Enabling and Conguring the Kernel Proler
You can enable and congure the kernel proler in the SAP HANA Database Explorer (Trace Conguration) or
you can manage the kernel proler from the SQL command line using the ALTER SYSTEM command. In both
cases RESOURCE ADMIN or TRACE ADMIN privileges are required.
Enabling Kernel Proler using SQL
The kernel proler statement supports basic functions such as start, stop, save and clear, but also a number of
options such as to run the prole for a specic location, for a specic user or within certain memory limits.
The following examples illustrate the basic usage of the ALTER SYSTEM command:
ALTER SYSTEM START KERNEL PROFILER
ALTER SYSTEM SAVE KERNEL PROFILER
The SAVE keyword stops the proler, saves the data (to the trace directory) and clears allocated memory. The
following statement starts proling at host:port ab1234:30003 and lters for the user specic trace (database
trace) prole MYTRACEPROFILE
ALTER SYSTEM START KERNEL PROFILER AT 'ab1234:30003' TRACEPROFILE
'MYTRACEPROFILE';
Refer to the SAP HANA SQL Reference Guide for further options and details of these commands.
Conguration Options in Database Explorer
Option
Description
Service(s) to prole The service(s) that you want to prole.
Sampling interval The amount of time the kernel proler is to wait between call stack retrievals.
When you activate the kernel proler, it retrieves the call stacks of relevant threads several
times. It waits between each sample for the length of time specied here minus the time the
previous retrieval took.
290 PUBLIC
SAP HANA Troubleshooting and Performance Analysis Guide
Tools and Tracing

Option Description
Memory limit Memory limit that will stop tracing.
The kernel proler can potentially use a lot a memory. To prevent the SAP HANA database
from running out of memory due to proling, you can specify a memory limit that cannot be
exceeded.
Optional lter The specic database user or application user you want to prole.
Kernel Proler Traces
Proling results are saved to two trace les. When started from SQL:
• kernel_proler_cpu.dot
• kernel_proler_wait.dot
When started from Database Explorer:
• CPU_<service>_<host>_<port>_<timestamp>.dot
• WAIT_<service>_<host>_<port>_<timestamp>.dot
To analyze these trace les you need a tool capable of reading the .dot output format, or you may be asked to
send the les to SAP Support.
View M_KERNEL_PROFILER
The view M_KERNEL_PROFILER displays the status of the proler (started or stopped) and provides
information about current kernel prolers. The view can also be accessed by users with RESOURCE ADMIN
and/or TRACE ADMIN privileges.
Further Information
An SAP Community blog Kernel proler ltered by connection ID and statement hash gives further details of this
feature.
Related Information
Diagnostic Files and Logs
M_KERNEL_PROFILER System View
ALTER SYSTEM {START | STOP | SAVE | CLEAR} KERNEL PROFILER Statement (System Management)
SAP Community Blog: Kernel proler ltered by connection ID and statement hash
SAP HANA Troubleshooting and Performance Analysis Guide
Tools and Tracing
PUBLIC 291
4.6.3Diagnosis Information
You can collect diagnosis information (a full system info dump) in the SAP HANA studio, in SAP HANA cockpit
or using command line scripts.
To collect this information in SAP HANA studio open the Administration Editor and navigate to Diagnosis
Files Diagnosis Information . Use the Collect function to run the system dump and use the List function to
download the dump to a local le.
To collect this information in SAP HANA cockpit, on the system overview page, under Alerting & Diagnostics,
select Manage full system information dumps. On the Diagnosis Files page, choose a zip le from the list or click
Collect Diagnostics to create a new zip le.
The SQL variant can be used when SAP HANA is online, otherwise you can use the Python script
fullSystemInfoDump.py in the python_support directory (shortcut cdpy):
python fullSystemInfoDump.py
When the dump has completed you can download the le from the snapshots directory: /usr/sap/HAN/sys/
global/sapcontrol/snapshots
All options related to getting a system dump are fully described in SAP Note 1732157. This note also includes a
video demonstration of the process.
Tip
Guided Answers is a support tool for troubleshooting problems using decision trees. A guided answer is
available on How to generate a runtime dump.
Related Information
SAP Note 1732157
How to generate a runtime dump (Guided Answer)
4.6.4Analysis Tools in SAP HANA Web-based Developer
Workbench
There are a number of tools available for application performance analysis in the SAP HANA Web-based
Developer Workbench.
292
PUBLIC
SAP HANA Troubleshooting and Performance Analysis Guide
Tools and Tracing
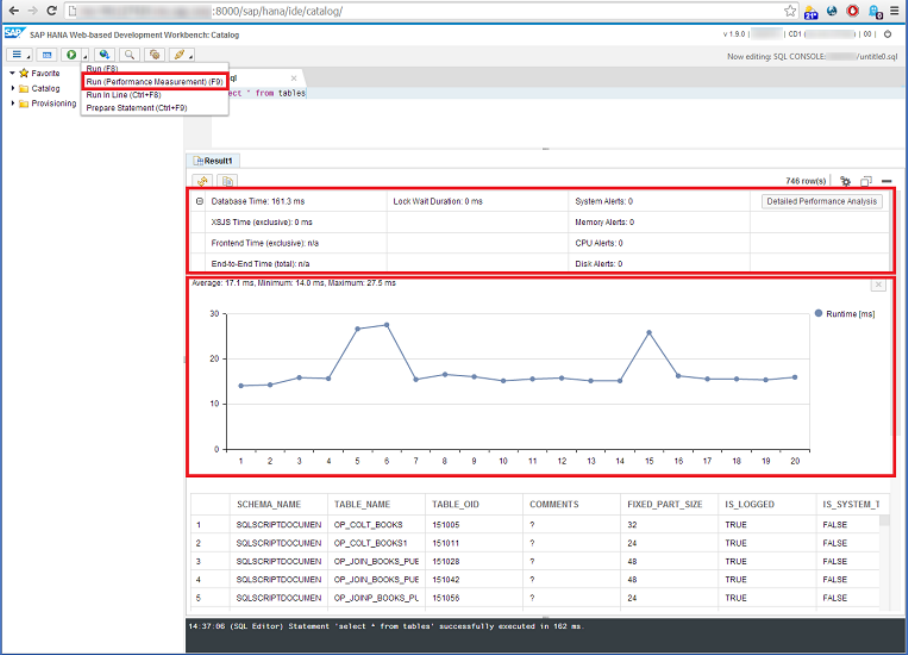
SQL Console
The extended SQL Console (part of the Catalog perspective) supports implicit and explicit performance
measurement while executing a SQL statement. It allows you to easily acquire sound measurement data and to
assess whether a SQL statement is problematic.
Implicit performance measurement can be triggered via F9 run command and provides execution time
information for the database, XS, and UI layers. Additional information to judge the measurement quality like
table locks and system alerts is also provided. Detailed performance analysis supports the repeated execution
of statements thus allows you to check whether performance characteristics are stable.
You can use this feature to quickly check SQL performance and to determine whether the observed poor
performance is caused by system load or variability.
Expensive Statements Trace
The expensive statements trace in the Trace perspective allows you to quickly analyze how the SQL layer of
your SAP HANA system is used (globally or within a specic session/application). It allows you to analyze if the
SAP HANA database is used eectively and eciently for a given application.
SAP HANA Troubleshooting and Performance Analysis Guide
Tools and Tracing
PUBLIC 293
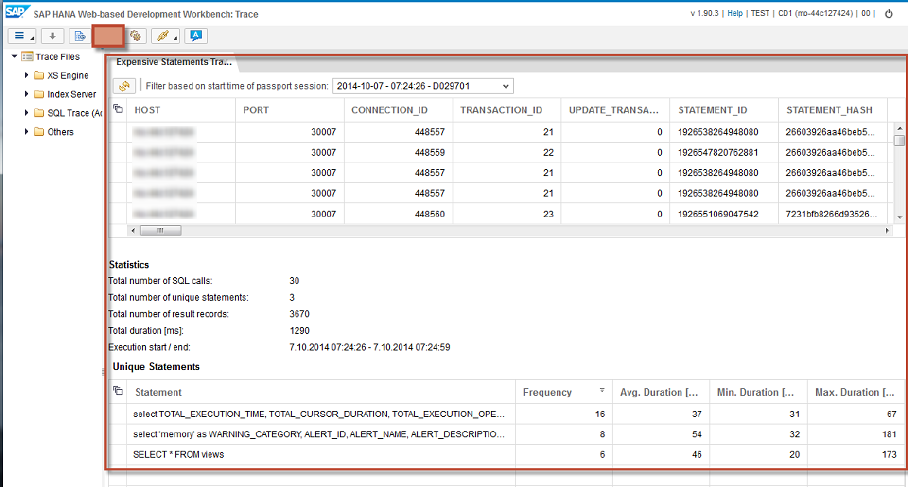
The expensive statement view supports ltering for passport-based application sessions - if the trace is
congured accordingly by the system administrator and you run your application with SAP passport. For each
statement you can see metrics such as start time, number of processed records and many more.
Furthermore, a statistical summary is provided that gives insight on the overall SQL load. It details metrics such
as:
• Number of statements executed
• Number of unique statements executed
• Number of result records
Last, for each unique statement summary statistics are shown that detail the frequency of their usage as well
as aggregated duration metrics.
You can use the expensive statement trace to analyze:
• the overall SQL load in your current system
• the SQL interaction of a specic application, for example, to gure out if an application that is not currently
performing well due to an issue on the application layer or on the database layer.
Immediate Database Performance Feedback
This feature is part of the Immediate Feedback context in WebIDE.It provides a performance overview of all SQL
statements which are executed during an Immediate Feedback session, thus helps application developers to
immediately understand the number and performance of their DB-related statements.
294
PUBLIC
SAP HANA Troubleshooting and Performance Analysis Guide
Tools and Tracing
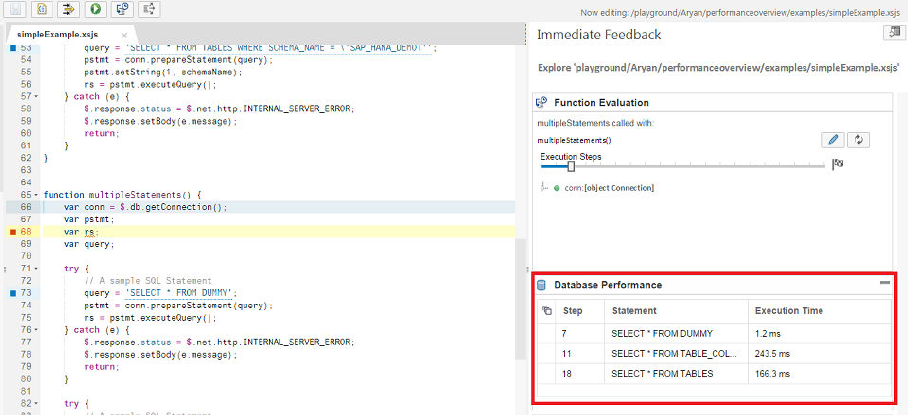
The Database Performance overview provides 3 metrics for each SQL statement: step, statement and
execution.
• Step: the actual immediate feedback step in which a SQL statement was executed
• Statement: the SQL statement
• Execution time: the execution time of the statement (in milliseconds)
You can use this feature to understand the performance behavior of the SQL statements (for example, nding
expensive statements that belong to a particular function) and exploit this understanding for possible further
performance investigations, like subsequently taking a dedicated measurement using the SQL Console.
SAP HANA Troubleshooting and Performance Analysis Guide
Tools and Tracing
PUBLIC 295

5 SAP HANA Database monitoring with
Solution Manager
This topic gives information about SAP HANA database monitoring with Solution Manager.
Setting up Solution Manager
SAP Solution Manager can be used to monitor one or more SAP HANA databases. A starting point to nd
all the information you require for the setup and conguration of the SAP HANA database monitoring using
solution manager can be found on the WIKI page SAP HANA Operations with SAP Solution Manager
A detailed step by step description of the conguration and setup is given in the WIKI subpage Managed
System Setup for SAP HANA
, the conguration and setup have dierent steps depending on the SAP HANA
database architecture and environment you have, for example, you may have Multitenant Database Containers
(MDC) and/ or system replication may be enabled in your environment.
There are two main steps:
1. You need to register the SAP HANA system you want to monitor in SLD
2. You need to do the managed system conguration steps for the HANA Database in the solution manager
system.
The Resolution part of the KBA 2436986 - Registration and Managed System Setup of SAP HANA in SAP
Solution Manager links you to the correct steps to follow depending on your HANA Architecture.
Troubleshooting when registering an SAP HANA Database in SLD
Before starting troubleshooting please double check that you have done the required conguration on the SAP
HANA database side and that you are aware of known documented issues. For this please refer to the SAP
HANA Database Administration Guide that is relevant for your HANA release and the notes referenced below:
In the SAP HANA Administration guide see the section Conguring a SAP HANA System to Connect to the
System Landscape Directory (SLD) .
If you are following the documentation above and the SLD registration is not successful please then check
the steps in the Resolution part of the KBA 2537537 - SLD does not update after registering HANA using
HDBLCM
.
If you still face a problem with the registration of the SAP HANA database in SLD please review the known
issues described in the below notes as they may be relevant for the issue that you face:
Important Notes for SAP HANA SLD Registration:
• 2729787 - FAQ: HANA Data Supplier for System Landscape Directory (SLD) and Focused Run (FRUN)
296
PUBLIC
SAP HANA Troubleshooting and Performance Analysis Guide
SAP HANA Database monitoring with Solution Manager
• 2697518 - Patch Level in LMDB and SLD show the HANA DB Service Pack Number and not its Patch
Level
• 2688902 - LMDB Shows Invalid Instance and Version Information for Products Installed on a SAP HANA
• 2607076 - Support of SLD Registration of an SAP HANA System Using Fully Qualied Domain Names
(FQDN) in SLDSYSTEMHOME and SLDVIRTDBHOME
• 2646035 - SLD Registration: The Former Primary Site of a System Replication Still Show the old Values in
SLD and Solution Manager After a Takeover
• 2577511 - Support of SLD Registration of a HANA System Replication or Multi Database Container
Setup
.
If you are not successful in resolving the problem with the above information, SAP Support would require the
following tracing and logs to further analyse issue:
Log les required for SAP HANA Database SLD registration problems
MDC Environment:
1. Increase the trace level on SYSTEMDB by executing the following SQL:
alter system alter configuration('nameserver.ini','SYSTEM')
SET ('trace','sldconfig') = 'debug', ('trace','sldcollect') = 'debug',
('trace','sldsend') = 'debug' with reconfigure;
2. Trigger the SLD data supplier by executing the following sql on SYSTEMDB:
alter system alter configuration ('nameserver.ini','SYSTEM')
SET ('sld','enable') = 'false' with reconfigure;
alter system alter configuration ('nameserver.ini','SYSTEM')
SET ('sld','enable') = 'true' with reconfigure;
3. Reset the trace level on SYSTEMDB to default:
alter system alter configuration('nameserver.ini','SYSTEM')
UNSET ('trace','sldconfig'), ('trace','sldcollect'), ('trace','sldsend') with
reconfigure;
4. Create a full system info dump of SYSTEMDB ( 1732157 - Collecting diagnosis information for SAP HANA
[VIDEO]
)
5. Provide the les slddest.cfg, sldreg.log and sldreg.xml from the HANA server:
/usr/sap/<SID>/HDB<instance>/<host>/trace/sldreg.xml sldreg.log/usr/sap/
<sid>/SYS/global/slddest.cfg
Additionally, from every HANA host on primary and in case of a system replication environment from every
host on secondary side:
/usr/sap/<SID>/profile/DEFAULT.PFL
6. Provide the content of the global.ini le by executing the sql command on SYSTEMDB and every tenant
DB. Provide the result as .csv le Select * from sys.m_inile_contents where le_name = 'global.ini' and
layer_name = 'SYSTEM';
What information is captured in the above SAP tracing?
SAP HANA Troubleshooting and Performance Analysis Guide
SAP HANA Database monitoring with Solution Manager
PUBLIC 297
nameserver.ini . > [trace]:
Trace Detail level
sldcollect = 'debug' lists every step of the data collection
sldcong = 'debug' lists the initial registration to SLD done by hdblcm
sldsend = 'debug' lists the path to the log le sldreg.log of the last data transfer
Managed system conguration of the SAP HANA Database in Solution
Manager
To perform the second step: managed system setup of the SAP HANA Database in solution manager please
refer to the following section of the SAP HANA Administration guide:
Connecting SAP Solution Manager to SAP HANA
Additional troubleshooting information for the SLD registration and the managed system setup of the SAP
HANA database in solution manager is available in the Wiki Trouble Shooting Guide for SAP Solution Manager
Operations for SAP HANA
Please be aware of the below knowledge repositories that described common issues and questions that come
up when using Solution Manager to monitor SAP HANA databases:
Important KBAs and Notes related to Solution Manager and HANA monitoring:
• 2374090 - SOLMAN_SETUP - BW Content Activation fails "ERROR: EC:2048" column store error: in
Solution Manager 7.2
• 2264627 - How to Troubleshoot Grey HANA Metrics in Technical Monitoring - SAP Solution Manager
• 2711824 - High Number of Prepared Statements Causing High Usage of Memory Allocator Pool/
Statistics
• 2211415 - SAP HANA alerting composite SAP Note
• 2147247 - FAQ: SAP HANA Statistics Server
• 1991615 - Conguration options for the Embedded Statistics Service
Technical requirements for setting up secondary database connection from Solution Manager to SAP HANA
Database:
• 1597627 - SAP HANA connection
Important changes regarding how Solution Manager collects monitoring information from SAP HANA
Database:
With SAP HANA Revisions >= 122.02 the method used by Solution manager to collect the alerting relating
information from a manged SAP HANA Database has been changed and optimized in such a way that
it reduces the workload on the SAP HANA Database for the statistics collection. To use this new HANA
Monitoring mechanism changes may be required on the solution manager system and the SAP HANA
Database, further information can be found in the SAP note 2374272 - Enabling new HANA Monitoring
mechanism for Solution Manager
298
PUBLIC
SAP HANA Troubleshooting and Performance Analysis Guide
SAP HANA Database monitoring with Solution Manager

Monitoring Recommendations
You observe dierences in parameter value recommendations coming from a solution manager generated
EWA report, HANA Parameter check script HANA_Conguration_Parameters_1.00.90+.txt script from KBA
1969700 - SQL Statement Collection for SAP HANA and/or EWA workspace tool (ewaviewer) . The root
cause is often that the EWA report generated from a customer’s solution manager system does not have the
latest information on the parameter value recommendations due to outdated version of solution manager
system orST-SER Release installed. Further information is available in the KBA: 2749491 - Dierences in EWA
report for HANA Parameter recommendations when compared with output of HANA parameter check script
HANA_Conguration_Parameters_1.00.90+.txt
SAP HANA Troubleshooting and Performance Analysis Guide
SAP HANA Database monitoring with Solution Manager
PUBLIC 299

6 Alerts and the Statistics Service
Alert checkers are part of the statistics service which is a central element of SAP HANA's internal monitoring
infrastructure.
The statistics service is a key administration resource which noties you when potentially critical situations
arise in your systems. The statistics service is described in detail in the SAP HANA Administration Guide.
Alert Checkers
A set of over 100 scheduled alert checkers run in the background monitoring the system for specic events. All
alerts include a recommended user action and for many alerts a corresponding SAP Note is available. Details of
all these alerts are given in the reference section which follows.
Alerts are dened in the following two tables:
• _SYS_STATISTICS.STATISTICS_ALERT_INFORMATION
• _SYS_STATISTICS.STATISTICS_ALERT_THRESHOLDS
Each alert also has a corresponding entry in the following statistics scheduling tables:
• _SYS_STATISTICS.STATISTICS_OBJECTS
• _SYS_STATISTICS.STATISTICS_SCHEDULE
Congurable Severity Levels
Many alert checkers are dened with threshold values so that a degree of severity can be indicated if the alert
is triggered. Default values are available for all severity thresholds and these can be over-ridden by user-dened
values using the administration tools SAP HANA Studio and SAP HANA Cockpit. The scale of severity values is
from one to four (1 = Information, 2 = Low, 3 = Medium, 4 = High) and alerts can use any, none or all of these as
required depending on the event which is being monitored and the unit of measurement. Some alerts have just
a single information level threshold and are not congurable.
A history of changes made to threshold levels for each alert is maintained and can be seen in system view
STATISTICS_ALERT_THRESHOLDS_HISTORY.
Conguration Tools
Alerts are congurable in either SAP HANA Studio or SAP HANA Cockpit:
• Studio:
Administration Alerts tab
• Cockpit: Alerting and Diagnostics Congure Alerts
Conguration activities and administration features for both Studio and Cockpit are described in the SAP
HANA Administration Guide. You are recommended to use Cockpit which provides more options; it includes, for
example, the ability to disable alerts and to trigger an alert manually on demand. A limitation in Studio is that
only alerts with multiple threshold values can be maintained.
If an alert check fails for any reason it is automatically de-activated by the system for a period of at least 60
minutes (1 hour + the interval length). This is done by setting the value of the schedule status to 'Inactive'
(_SYS_STATISTICS.STATISTICS_SCHEDULE STATUS). Alert checkers are re-enabled automatically after the
timeout period by setting the schedule status to 'Idle' (this restart feature was introduced in HANA 01 SPS 09
Revision 93).
300
PUBLIC
SAP HANA Troubleshooting and Performance Analysis Guide
Alerts and the Statistics Service
Refer to SAP Note 1991615 - Conguration options for the Embedded Statistics Service for more details of the
statistics service and examples of managing the service from the SQL command line.
Related Information
SAP HANA Administration Guide
SAP Note 1991615
6.1 Alerts Reference
Details of alerts in HANA 2.0 SPS07.
ID: 0
Name: Internal statistics server problem
Description: Identies internal statistics server problem.
Category: Availability
User Action: Resolve the problem. For more information, see the trace les. You may need to activate
tracing rst.
Further information:
SAP Note: 1803039 Statistics server CHECK_HOSTS_CPU intern. error when restart
ID: 1
Name: Host physical memory usage
Description: Determines what percentage of total physical memory available on the host is used. All
processes consuming memory are considered, including non-SAP HANA processes.
Note
Only relevant in HANA 1.0. Not active in HANA 2.0. See SAP Note: 2757696 Alert 1
shows wrong information
Category: Memory
Unit: percent
Thresholds / Severity: Default threshold(s): 95; 98; 100
Severity level(s): 2; 3; 4
SAP HANA Troubleshooting and Performance Analysis Guide
Alerts and the Statistics Service
PUBLIC 301
User Action: Investigate memory usage of processes.
Further information:
SAP Note: 1898317 How to handle HANA Alert 1: 'Host physical memory usage'; SAP
Note: 1840954 Alerts related to HANA memory consumption
ID: 2
Name: Disk usage
Description: Determines what percentage of each disk containing data, log, and trace les is used. This
includes space used by non-SAP HANA les.
Category: Disk
Unit: percent
Thresholds / Severity: Default threshold(s): 90; 95; 98
Severity level(s): 2; 3; 4
User Action: Investigate disk usage of processes. Increase disk space, for example by shrinking volumes,
deleting diagnosis les, or adding additional storage.
Further information:
SAP Note: 1900643 How to handle HANA Alert 2: 'Disk usage'
ID: 3
Name: Inactive services
Description: Identies inactive services.
Category: Availability
Unit: seconds
Thresholds / Severity: Default threshold(s): 600
Severity level(s): 4
User Action: Investigate why the service is inactive, for example, by checking the service's trace les.
Further information:
Inactive > 600 seconds. SAP Note: 1902033 How to handle HANA Alert 3: 'Inactive
Services'
ID: 4
Name: Restarted services
Description: Identies services that have restarted since the last time the check was performed.
302 PUBLIC
SAP HANA Troubleshooting and Performance Analysis Guide
Alerts and the Statistics Service
Category: Availability
User Action: Investigate why the service had to restart or be restarted, for example, by checking the
service's trace les.
Further information:
SAP Note: 1909660 How to handle HANA Alert 4: 'Restarted services'
ID: 5
Name: Host CPU Usage
Description: Determines the percentage CPU idle time on the host and therefore whether or not CPU
resources are running low.
Category: CPU
Unit: percent
Thresholds / Severity: Default threshold(s): 25; 15; 10
Severity level(s): 2; 3; 4
User Action: Investigate CPU usage.
Further information:
SAP Note: 1909670 How to handle HANA Alert 5: 'Host CPU Usage'
ID: 6
Name: Address space usage
Description: Determines the address space consumption
Category: Memory
Unit: percent
Thresholds / Severity: Default threshold(s): 70; 80; 90
Severity level(s): 2; 3; 4
User Action: Prepare to restart HANA.
ID: 7
Name: Timer fallback
Description: Noties about the usage of the system timer fallback. The system timer is slower than
native HANA timer.
Category: Conguration
SAP HANA Troubleshooting and Performance Analysis Guide
Alerts and the Statistics Service
PUBLIC 303
User Action: Use HANA on a system conguration with Time Stamp Counter invariant set. See SAP Note
2753418.
Further information:
SAP Note: 2753418 Potential Performance Degradation Due to Timer Fallback
ID: 10
Name: Delta merge (mergedog) conguration
Description: Determines whether or not the 'active' parameter in the 'mergedog' section of system con-
guration le(s) is 'yes'. mergedog is the system process that periodically checks column
tables to determine whether or not a delta merge operation needs to be executed.
Category: Conguration
User Action: Change in SYSTEM layer the parameter active in section(s) mergedog to yes
Further information:
SAP Note: 1909641 How to handle HANA Alert 10 - 'Delta Merge (mergedog) Congura-
tion'
ID: 12
Name: Memory usage of name server
Description: Determines what percentage of allocated shared memory is being used by the name server
on a host.
Category: Memory
Unit: percent
Thresholds / Severity: Default threshold(s): 70; 80
Severity level(s): 3; 4
User Action: Increase the shared memory size of the name server. In the 'topology' section of the name-
server.ini le, increase the value of the 'size' parameter.
Further information:
SAP Note: 1977101 How to handle HANA Alert 12: 'Memory usage of name server'
ID: 17
Name: Record count of non-partitioned column-store tables
Description: Determines the number of records in non-partitioned column-store tables. Current table
size may not be critical. Partitioning need only be considered if tables are expected to grow
rapidly (a non-partitioned table cannot contain more than 2,147,483,648 (2 billion) rows).
Category: Memory
304 PUBLIC
SAP HANA Troubleshooting and Performance Analysis Guide
Alerts and the Statistics Service
Unit: records
Thresholds / Severity: Default threshold(s): 300000000
Severity level(s): 1
User Action: Consider partitioning the table only if you expect it to grow rapidly.
Further information:
SAP HANA Administration Guide > Table Partitioning, SAP Note: 1909763 How to handle
HANA Alert 17: 'Record count of non-partitioned column-store tables'
ID: 20
Name: Table growth of non-partitioned column-store tables
Description: Determines the growth rate of non-partitioned columns tables.
Category: Memory
Unit: percent
Thresholds / Severity: Default threshold(s): 5; 7,5; 10
Severity level(s): 2; 3; 4
User Action: Consider partitioning the table. See also: Guided Answer: How to reduce the size of a table.
Further information:
SAP HANA Administration Guide > Table Partitioning, SAP Note: 1910140 How to Handle
Alert 20 'Table growth of non-partitioned column-store tables'
ID: 21
Name: Internal event (Information event)
Description: Identies internal database events.
Some events, which do not generate a specic alert, are captured as internal (or ‘info’)
events. Info events trigger alert 21 and details of the event, together with an event ID value,
are logged in the view M_EVENTS. Refer to the ‘Additional info’ value of the event for more
information about the source of the event.
Category: Availability
Severity: INFO
User Action: No action required.
Further information:
SAP Note: 3435373 Alert 21 Flooding 'Too many jobs collecting disk info' and 'Disk info
job stuck for very long time'
SAP HANA Troubleshooting and Performance Analysis Guide
Alerts and the Statistics Service
PUBLIC 305
ID: 22
Name: Notication of all alerts
Description: Determines whether or not there have been any alerts since the last check and if so, sends a
summary e-mail to specied recipients.
Category: Availability
User Action: Investigate the alerts.
ID: 23
Name: Notication of medium and high priority alerts
Description: Determines whether or not there have been any medium and high priority alerts since the
last check and if so, sends a summary e-mail to specied recipients.
Category: Availability
User Action: Investigate the alerts.
ID: 24
Name: Notication of high priority alerts
Description: Determines whether or not there have been any high priority alerts since the last check and
if so, sends a summary e-mail to specied recipients.
Category: Availability
User Action: Investigate the alerts.
ID: 25
Name: Open connections
Description: Determines what percentage of the maximum number of permitted SQL connections are
open. The maximum number of permitted connections is congured in the "session" sec-
tion of the indexserver.ini le.
Category: Sessions/Transactions
Unit: percent
Thresholds / Severity: Default threshold(s): 90; 95; 98
Severity level(s): 2; 3; 4
User Action: Investigate why the maximum number of permitted open connections is being approached.
306 PUBLIC
SAP HANA Troubleshooting and Performance Analysis Guide
Alerts and the Statistics Service
Further information:
SAP Note: 1910159 How to handle HANA Alert 25: 'Check number of connections'
ID: 26
Name: Unassigned volumes
Description: Identies volumes that are not assigned a service.
Category: Conguration
User Action: Investigate why the volume is not assigned a service. For example, the assigned service
is not active, the removal of a host failed, or the removal of a service was performed
incorrectly.
Further information:
SAP Note: 1910169 How to handle HANA Alert 26: 'Unassigned volumes'
ID: 27
Name: Record count of column-store table partitions
Description: Determines the number of records in the partitions of column-store tables. A table partition
cannot contain more than 2,147,483,648 (2 billion) rows.
Category: Memory
Unit: records
Thresholds / Severity: Default threshold(s): 1500000000; 1800000000; 1900000000
Severity level(s): 2; 3; 4
User Action: Consider repartitioning the table.
Further information:
SAP HANA Administration Guide > Table Partitioning, SAP Note: 1910188 How to handle
HANA Alert 27: 'Record count of column-store table partitions'
ID: 28
Name: Most recent savepoint operation
Description: Determines how long ago the last savepoint was dened, that is, how long ago a complete,
consistent image of the database was persisted to disk.
Category: Disk
Unit: minutes
Thresholds / Severity: Default threshold(s): 60; 120; 300
Severity level(s): 1; 2; 3
SAP HANA Troubleshooting and Performance Analysis Guide
Alerts and the Statistics Service
PUBLIC 307
User Action: Investigate why there was a delay dening the last savepoint and consider triggering the
operation manually by executing the SQL statement ALTER SYSTEM SAVEPOINT.
Further information:
SAP Note: 1977291 Handle HANA Alert 28: 'Most recent savepoint operation'
ID: 29
Name: Size of delta storage of column-store tables
Description: Determines exceptionally large delta storages of column tables.
Category: Memory
Unit: values <= 100 in percent of the process allocation limit on the host where the table is
located, greater values in MB
Thresholds / Severity: Default % threshold(s): 0.5; 1.0; 2.0; 4.0
Severity level(s): 1; 2; 3; 4
User Action: See SAP Knowledge Base Note 1977314. Investigate the delta merge history in the monitor-
ing view M_DELTA_MERGE_STATISTICS. Consider merging the table delta manually.
Further information:
SAP Note: 1977314 How to handle HANA Alert 29: 'Size of delta storage of column-store
tables'
ID: 30
Name: Check internal disk full event
Description: Determines whether or not the disks to which data and log les are written are full. A
disk-full event causes your database to stop and must be resolved.
Category: Disk
Unit: state
Thresholds / Severity: Default threshold(s): HANDLED, NEW
Severity level(s): 2; 4
User Action: Resolve the disk-full event as follows: In the Administration Editor on the Overview tab,
choose the "Disk Full Events" link and mark the event as handled. Alternatively, execute the
SQL statements ALTER SYSTEM SET EVENT ACKNOWLEDGED '<host>:<port>' <id> and
ALTER SYSTEM SET EVENT HANDLED '<host>:<port>' <id>.
Further information:
SAP Note: 1898460 How to Handle Alert 30 'Internal disk-full event'
ID: 31
308 PUBLIC
SAP HANA Troubleshooting and Performance Analysis Guide
Alerts and the Statistics Service
Name: License expiry
Description: Determines how many days until your license expires. Once your license expires, you can no
longer use the system, except to install a new license.
Category: Availability
Unit: day
Thresholds / Severity: Default threshold(s): 30; 14; 7
Severity level(s): 2; 3; 4
User Action: Obtain a valid license and install it. For the exact expiration date, see the monitoring view
M_LICENSE.
Further information:
Security, Authorization and Licensing, SAP Note: 1899480 How to handle HANA Alert 31:
'License expiry'
ID: 33
Name: Log mode OVERWRITE
Description: Determines whether or not the database is running in log mode "overwrite". Log mode
"overwrite" does not support point-in-time-recovery (only recovery to a data backup) and is
not recommended for productive systems.
Category: Backup
User Action: If you need point-in-time recovery, recongure the log mode of your system to "normal". In
the "persistence" section of the global.ini conguration le, set the parameter "log_mode"
to "normal" for the System layer. You are recommended to perform a full data backup. See
Issues with Conguration Parameter log_mode
Further information:
SAP HANA Administration Guide > Backup and Recovery, SAP Note: 1900267 How to
handle HANA Alert 33 - 'Log mode OVERWRITE'
ID: 34
Name: Unavailable volumes
Description: Determines whether or not all volumes are available.
Category: Conguration
User Action: Investigate why the volume is not available.
Further information:
SAP HANA Administration Guide > Backup and Recovery, SAP Note: 1900682 How to
handle HANA Alert 34: Unavailable Volumes
SAP HANA Troubleshooting and Performance Analysis Guide
Alerts and the Statistics Service
PUBLIC 309
ID: 35
Name: Existence of data backup
Description: Determines whether or not a data backup exists. Without a data backup, your database
cannot be recovered.
Category: Backup
User Action: Perform a data backup as soon as possible.
Further information:
SAP HANA Administration Guide > Backup and Recovery, SAP Note: 1900728 How to
handle HANA Alert 35: 'Existence of Data Backup'
ID: 36
Name: Status of most recent data backup
Description: Determines whether or not the most recent data backup was successful.
Category: Backup
User Action: Investigate why the last data backup failed, resolve the problem, and perform a new data
backup as soon as possible.
Further information:
SAP HANA Administration Guide > Backup and Recovery, SAP Note: 1900795 How to
handle HANA alert 36: 'Status of Most Recent Data Backup'
ID: 37
Name: Age of most recent data backup
Description: Determines the age of the most recent successful data backup.
Category: Backup
Unit: day
Thresholds / Severity: Default threshold(s): 5; 7 ; 20
Severity level(s): 2; 3; 4
User Action: Perform a data backup as soon as possible.
Further information:
SAP HANA Administration Guide > Backup and Recovery, SAP Note: 1900730 How to
handle HANA Alert 37 - 'Age of most recent data backup'
ID: 38
Name: Status of most recent log backups
310 PUBLIC
SAP HANA Troubleshooting and Performance Analysis Guide
Alerts and the Statistics Service
Description: Determines whether or not the most recent log backups for services and volumes were
successful.
Category: Backup
User Action: Investigate why the log backup failed and resolve the problem.
Further information:
SAP HANA Administration Guide > Backup and Recovery, SAP Note: 1900788 How to
handle HANA Alert 38: 'Status of Most Recent Log Backup'
ID: 39
Name: Long-running statements
Description: Identies long-running SQL statements.
Category: Sessions/Transactions
Unit: seconds
Thresholds / Severity: Default threshold(s): 1800; 2700; 3600
Severity level(s): 1; 2; 3
User Action: Investigate the statement. For more information, see the table _SYS_STATIS-
TICS.HOST_LONG_RUNNING_STATEMENTS.
Further information:
SAP Note: 1849392 HANA alerts related to locks, hanging sessions and long runners
ID: 40
Name: Total memory usage of column-store tables
Description: Determines what percentage of the eective allocation limit is being consumed by individual
column-store tables as a whole (that is, the cumulative size of all of a table's columns and
internal structures)
Category: Memory
Unit: percent
Thresholds / Severity: Default threshold(s): 20; 25; 30
Severity level(s): 1; 2; 3
User Action: Consider partitioning or repartitioning the table.
Further information:
SAP Note: 1977268 How to handle HANA Alert 40: 'Total memory usage of column-store
tables'
SAP HANA Troubleshooting and Performance Analysis Guide
Alerts and the Statistics Service
PUBLIC 311
ID: 41
Name: In-memory DataStore activation
Description: Determines whether or not there is a problem with the activation of an in-memory Data-
Store object.
Category: Availability
User Action: For more information, see the table _SYS_STATISTICS.GLOBAL_DEC_EXTRACTOR_STATUS
and SAP Note 1665553.
Further information:
SAP Note: 1665553 How to handle HANA Alert 41: 'Check the In-memory DataStore
activation'; SAP Note: 1977230 Handling issues with IMDSO activation - SAP HANA DXC
ID: 42
Name: Long running/idling cursors
Description: Identies long running/idling cursors. The threshold is based on M_INIFILE_CON-
TENTS.VALUE where KEY = "idle_cursor_lifetime".
Category: Sessions/Transactions
Unit: ratio
Thresholds / Severity: Default threshold(s): 0.5; 0.7 ;0.9
Severity level(s): 2; 3; 4
User Action: Close the cursor in the application, or kill the connection by executing the SQL statement
ALTER SYSTEM DISCONNECT SESSION <LOGICAL_CONNECTION_ID>.For more informa-
tion, see the table HOST_LONG_IDLE_CURSOR (_SYS_STATISTICS).
Further information:
SAP Note: 1900261 How to handle HANA Alert 42: 'Long-Running Cursors'
ID: 43
Name: Memory usage of services
Description: Determines what percentage of its eective allocation limit a service is using.
Category: Memory
Unit: percent
Thresholds / Severity: Default threshold(s): 80; 90; 95
Severity level(s): 2; 3; 4
User Action: Check for services that consume a lot of memory.
312 PUBLIC
SAP HANA Troubleshooting and Performance Analysis Guide
Alerts and the Statistics Service
Further information:
SAP Note: 1900257 How to handle HANA Alert 43: 'Memory Usage of Services'
ID: 44
Name: Licensed memory usage
Description: Determines what percentage of licensed memory is used.
Category: Memory
Unit: percent
Thresholds / Severity: Default threshold(s): 98
Severity level(s): 1
User Action: Increase licensed amount of main memory. You can see the peak memory allocation since
installation in the system view M_LICENSE (column PRODUCT_USAGE).
Further information:
SAP Note: 1899511 How to handle HANA Alert 44 'Licensed Memory Usage'
ID: 45
Name: Memory usage of main storage of column-store tables
Description: Determines what percentage of the eective allocation limit is being consumed by the main
storage of individual column-store tables.
Category: Memory
Unit: percent
Thresholds / Severity: Default threshold(s): 20; 25; 30
Severity level(s): 1; 2; 3
User Action: Consider partitioning or repartitioning the table.
Further information:
SAP Note: 1977269 How to handle HANA Alert 45: 'Check memory usage of main stor-
age of column-store tables'
ID: 46
Name: RTEdump les
Description: Identies new runtime dump les (*rtedump*) have been generated in the trace directory of
the system. These contain information about, for example, build, loaded modules, running
threads, CPU, and so on.
Category: Diagnosis Files
SAP HANA Troubleshooting and Performance Analysis Guide
Alerts and the Statistics Service
PUBLIC 313
User Action: Check the contents of the dump les.
Further information:
SAP Note: 1977099 How to handle HANA Alert 46: 'Check for new RTE dump les'
ID: 47
Name: Long-running serializable transactions
Description: Identies long-running serializable transactions.
Category: Sessions/Transactions
Unit: ratio
Thresholds / Severity: Default threshold(s): 0.7; 0.9
Severity level(s): 3; 4
User Action: Close the serializable transaction in the application or kill the connection by executing the
SQL statement ALTER SYSTEM DISCONNECT SESSION <LOGICAL_CONNECTION_ID>. For
more information, see the table HOST_LONG_SERIALIZABLE_TRANSACTION (_SYS_STA-
TISTICS).
Further information: Transactional Problems [page 167]
ID: 48
Name: Long-running uncommitted write transactions
Description: Identies long-running uncommitted write transactions.
Category: Sessions/Transactions
Unit: ratio
Thresholds / Severity: Default threshold(s): 0.7; 0.9
Severity level(s): 3; 4
User Action: Close the uncommitted transaction in the application or kill the connection by exe-
cuting the SQL statement ALTER SYSTEM DISCONNECT SESSION <LOGICAL_CONNEC-
TION_ID>. For more information, see the table HOST_UNCOMMITTED_WRITE_TRANSAC-
TION (_SYS_STATISTICS).
Further information:
SAP Note: 1977276 How to handle HANA Alert 48: 'Check a long-running uncommitted
write transaction'
ID: 49
Name: Long-running blocking situations
314 PUBLIC
SAP HANA Troubleshooting and Performance Analysis Guide
Alerts and the Statistics Service
Description: Identies long-running blocking situations.
Category: Sessions/Transactions
Unit: minutes
Thresholds / Severity: Default threshold(s): 15; 20; 25
Severity level(s): 2; 3; 4
User Action: Investigate the blocking and blocked transactions and if appropriate cancel one of them.
Further information:
SAP Note: 2079396 How to handle HANA Alert 49: 'long-running blocking transaction'
ID: 50
Name: Number of diagnosis les
Description: Determines the number of diagnosis les written by the system (excluding zip-les). An
unusually large number of les can indicate a problem with the database (for example,
problem with trace le rotation or a high number of crashes).
Category: Diagnosis Files
Unit: les
Thresholds / Severity: Default threshold(s): 200
Severity level(s): 2
User Action: Investigate the diagnosis les.
Further information:
SAP Note: 1977162 How to handle HANA Alert 50: 'Number of Diagnosis les'
ID: 51
Name: Size of diagnosis les
Description: Identies large diagnosis les. Unusually large les can indicate a problem with the data-
base.
Category: Diagnosis Files
Unit: MB
Thresholds / Severity: Default threshold(s): 1024; 2048
Severity level(s): 2; 3
User Action: Check the diagnosis les in the SAP HANA studio for details.
Further information:
SAP Note: 1977208 How to handle HANA Alert 51: 'Size of diagnosis les'
SAP HANA Troubleshooting and Performance Analysis Guide
Alerts and the Statistics Service
PUBLIC 315
ID: 52
Name: Crashdump les
Description: Identies new crashdump les that have been generated in the trace directory of the sys-
tem.
Category: Diagnosis Files
User Action: Check the contents of the dump les.
Further information:
SAP Note: 1977218 How to handle HANA Alert 52 'Check for new crash dump les'
ID: 53
Name: Pagedump les
Description: Identies new pagedump les that have been generated in the trace directory of the system.
Category: Diagnosis Files
User Action: Check the contents of the dump les.
Further information:
SAP Note: 1977242 How to handle HANA Alert 53: 'Pagedump les'
ID: 54
Name: Savepoint duration
Description: Identies long-running savepoint operations.
Category: Backup
Unit: seconds
Thresholds / Severity: Default threshold(s): 300; 600; 900
Severity level(s): 1; 2; 3
User Action: Check disk I/O performance.
Further information: CPU Related Root Causes and Solutions, I/O Related Root Causes and Solutions [page 114],
SAP Note: 1977220
How to handle HANA Alert 54: Savepoint Duration
ID: 55
Name: Columnstore unloads
Description: Determines how many columns in columnstore tables have been unloaded from memory.
This can indicate performance issues.
316 PUBLIC
SAP HANA Troubleshooting and Performance Analysis Guide
Alerts and the Statistics Service
Category: Memory
Unit: tables
Thresholds / Severity: Default threshold(s): 1000; 10000; 100000
Severity level(s): 1; 2; 3
User Action: Check sizing with respect to data distribution.
Further information:
SAP Note: 1977207 How to handle HANA Alert 55: Columnstore unloads
ID: 56
Name: Python trace activity
Description: Determines whether or not the python trace is active and for how long. The python trace
aects system performance.
Category: Diagnosis Files
Unit: minutes
Thresholds / Severity: Default threshold(s): 20; 60; 300
Severity level(s): 1; 2; 3
User Action: If no longer required, deactivate the python trace in the relevant conguration le.
Further information:
SAP Note: 1977098 How to handle HANA Alert 56: Python trace activity
ID: 57
Name: Instance secure store le system (SSFS) inaccessible
Description: Determines if the instance secure store in the le system (SSFS) of your SAP HANA system
is accessible to the database.
Category: Security
Unit: state
Thresholds / Severity: Default threshold(s): 1
Severity level(s): 4
User Action: Check and make sure that the instance SSFS is accessible to the database.
Further information:
SAP Note: 1977221 How to handle HANA Alert 57: 'Secure store le system (SSFS)
availability'
SAP HANA Troubleshooting and Performance Analysis Guide
Alerts and the Statistics Service
PUBLIC 317
ID: 58
Name: Plan cache size
Description: Determines whether or not the plan cache is too small.
Category: Memory
Unit: evictions
Thresholds / Severity: Default threshold(s): 1000
Severity level(s): 1
User Action: Currently Alert 58 is inactive and replaced by Alert 91. Please activate Alert 91 - Plan Cache
Hit Ratio
Further information:
SAP Note: 1977253 How to handle HANA Alert 58 - 'Plan Cache Size'
ID: 59
Name: Percentage of transactions blocked
Description: Determines the percentage of transactions that are blocked.
Category: Sessions/Transactions
Unit: percent
Thresholds / Severity: Default threshold(s): 5; 10; 20
Severity level(s): 2; 3; 4
User Action: Investigate blocking and blocked transactions and if appropriate cancel some of them.
Further information:
SAP Note: 2081856 How to handle HANA Alert 59: 'Percentage of transactions blocked'
ID: 60
Name: Sync/Async read ratio
Description: Identies a bad trigger asynchronous read ratio. This means that asynchronous reads are
blocking and behave almost like synchronous reads. This might have negative impact on
SAP HANA I/O performance in certain scenarios.
Category: Disk
Unit: ratio
Thresholds / Severity: Default threshold(s): 0.5
Severity level(s): 1
318 PUBLIC
SAP HANA Troubleshooting and Performance Analysis Guide
Alerts and the Statistics Service
User Action: Please refer to SAP note 1930979.
Further information:
I/O Related Root Causes and Solutions [page 114], SAP Note: 1965379 Correction of
thresholds for Alerts 60 & 61 in HANA Revision 70 (SPS7)
ID: 61
Name: Sync/Async write ratio
Description: Identies a bad trigger asynchronous write ratio. This means that asynchronous writes are
blocking and behave almost like synchronous writes. This might have negative impact on
SAP HANA I/O performance in certain scenarios.
Category: Disk
Unit: ratio
Thresholds / Severity: Default threshold(s): 0.5
Severity level(s): 1
User Action: Please refer to SAP note 1930979.
Further information:
I/O Related Root Causes and Solutions [page 114], SAP Note: 1965379 Correction of
thresholds for Alerts 60 & 61 in HANA Revision 70 (SPS7)
ID: 62
Name: Expiration of database user passwords
Description: Identies database users whose password is due to expire in line with the congured pass-
word policy. If the password expires, the user will be locked. If the user in question is a
technical user, this may impact application availability. It is recommended that you disable
the password lifetime check of technical users so that their password never expires (ALTER
USER <username> DISABLE PASSWORD LIFETIME).
Category: Security
User Action: Change the password of the database user.
Further information:
SAP Note: 2082406 How to handle HANA Alert 62: Expiration of database user pass-
words
ID: 63
Name: Granting of SAP_INTERNAL_HANA_SUPPORT role
Description: Determines if the internal support role (SAP_INTERNAL_HANA_SUPPORT) is currently
granted to any database users.
SAP HANA Troubleshooting and Performance Analysis Guide
Alerts and the Statistics Service
PUBLIC 319
Category: Security
Unit: users
Thresholds / Severity: Default threshold(s): 1
Severity level(s): 2
User Action: Check if the corresponding users still need the role. If not, revoke the role from them.
Further information:
SAP Note: 2081857 Handle HANA Alert 63: Granting of SAP_INTERNAL_HANA_SUP-
PORT role
ID: 64
Name: Total memory usage of table-based audit log
Description: Determines what percentage of the eective memory allocation limit is being consumed
by the database table used for table-based audit logging. If this table grows too large, the
availability of the database could be impacted.
Category: Memory
Unit: percent
Thresholds / Severity: Default threshold(s): 5; 7; 9; 11
Severity level(s): 1; 2; 3; 4
User Action: Consider exporting the content of the table and then truncating the table.
Further information:
SAP Note: 2081869 How to handle HANA Alert 64: 'Total memory usage of table-based
audit log'
ID: 65
Name: Runtime of the log backups currently running
Description: Determines whether or not the most recent log backup terminates in the given time.
Category: Backup
Unit: seconds
Thresholds / Severity: Default threshold(s): 30; 300; 900
Severity level(s): 2; 3; 4
User Action: Investigate why the log backup runs for too long, and resolve the issue.
Further information:
SAP HANA Administration Guide, SAP Note: 2081845 How to handle HANA Alert 65:
'Runtime of the log backups currently running'
320 PUBLIC
SAP HANA Troubleshooting and Performance Analysis Guide
Alerts and the Statistics Service
ID: 66
Name: Storage snapshot is prepared
Description: Determines whether or not the period, during which the database is prepared for a storage
snapshot, exceeds a given threshold.
Category: Backup
Unit: seconds
Thresholds / Severity: Default threshold(s): 300; 900; 3600
Severity level(s): 2; 3; 4
User Action: Investigate why the storage snapshot was not conrmed or abandoned, and resolve the
issue.
Further information:
SAP HANA Administration Guide, SAP Note: 2081405 How to handle HANA Alert 66:
'Storage snapshot is prepared'
ID: 67
Name: Table growth of rowstore tables
Description: Determines the growth rate of rowstore tables
Category: Memory
Unit: percent
Thresholds / Severity: Default threshold(s): 5; 7.5; 10
Severity level(s): 2; 3; 4
User Action: Try to reduce the size of row store table by removing unused data
Further information:
SAP Note: 2054411 How to handle Alert 67: 'Table growth of Row Store Tables'
ID: 68
Name: Total memory usage of row store
Description: Determines the current memory size of a row store used by a service
Category: Memory
Unit: percent
Thresholds / Severity: Default threshold(s): 70; 80; 90
Severity level(s): 2; 3; 4
SAP HANA Troubleshooting and Performance Analysis Guide
Alerts and the Statistics Service
PUBLIC 321
User Action: Investigate memory usage by row store tables and consider cleanup of unused data
Further information:
SAP Note: 2050579 How to handle HANA Alert 68: 'total memory usage of row store'
ID: 69
Name: Enablement of automatic log backup
Description: Determines whether automatic log backup is enabled.
Category: Backup
User Action: Enable automatic log backup. For more details please see SAP HANA Administration Guide.
Further information:
SAP Note: 2081360 Handle HANA Alert 69: Enablement of automatic log backup
ID: 70
Name: Consistency of internal system components after system upgrade
Description: Veries the consistency of schemas and tables in internal system components (for example,
the repository) after a system upgrade.
Category: Availability
User Action: Contact SAP support.
ID: 71
Name: Row store fragmentation
Description: Check for fragmentation of row store.
Category: Memory
User Action: Implement SAP Note 1813245.
Further information:
SAP Note: 1813245 Short dump when changing LC status
ID: 72
Name: Number of log segments
Description: Determines the number of log segments in the log volume of each serviceCheck for number
of log segments.
Category: Backup
Unit: log segments
322 PUBLIC
SAP HANA Troubleshooting and Performance Analysis Guide
Alerts and the Statistics Service
Thresholds / Severity: Default threshold(s): 5000; 7000; 9000
Severity level(s): 2; 3; 4
User Action: Make sure that log backups are being automatically created and that there is enough space
available for them. Check whether the system has been frequently and unusually restarting
services. If it has, then resolve the root cause of this issue and create log backups as soon as
possible.
ID: 73
Name: Overow of rowstore version space
Description: Determines the overow ratio of the rowstore version space.
Category: Memory
Unit: ratio
Thresholds / Severity: Default threshold(s): 10; 50; 100
Severity level(s): 2; 3; 4
User Action: This alert is deprecated. Please refer to alert 75 "Rowstore version space skew" for indica-
tion of rowstore version accumulation
Further information: Transactional Problems [page 167]
ID: 74
Name: Overow of metadata version space
Description: Determines the overow ratio of the metadata version space.
Category: Memory
Unit: ratio
Thresholds / Severity: Default threshold(s): 10; 50; 100
Severity level(s): 2; 3; 4
User Action: This alert is deprecated. Please refer to alert 75 "Rowstore version space skew" for indica-
tion of rowstore version accumulation
Further information: Transactional Problems [page 167]
ID: 75
Name: Rowstore version space skew
SAP HANA Troubleshooting and Performance Analysis Guide
Alerts and the Statistics Service
PUBLIC 323
Description: Determines whether the rowstore version chain is too long.
Category: Memory
Unit: versions
Thresholds / Severity: Default threshold(s): 10000; 100000; 1000000
Severity level(s): 2; 3; 4
User Action: Identify the connection or transaction that is blocking version garbage collection. You can
do this in the SAP HANA studio by executing "MVCC Blocker Statement" and "MVCC
Blocker Transaction" available on the System Information tab of the Administration editor.
If possible, kill the blocking connection or cancel the blocking transaction. For your infor-
mation, you can nd table information by using query "SELECT * FROM TABLES WHERE
TABLE_OID = <table object ID>".
Further information: Transactional Problems [page 167]
ID: 76
Name: Discrepancy between host server times
Description: Identies discrepancies between the server times of hosts in a scale-out system.
Category: Conguration
Unit: minutes
Thresholds / Severity: Default threshold(s): 1; 2; 3
Severity level(s): 2; 3; 4
User Action: Check operating system time settings.
ID: 77
Name: Database disk usage
Description: Determines the total used disk space of the database. All data, logs, traces and backups are
considered.
Category: Disk
Unit: GB
Thresholds / Severity: Default threshold(s): 300; 400; 500
Severity level(s): 2; 3; 4
User Action: Investigate the disk usage of the database. See system view M_DISK_USAGE for more
details.
324 PUBLIC
SAP HANA Troubleshooting and Performance Analysis Guide
Alerts and the Statistics Service
ID: 78
Name: Connection between systems in system replication setup
Description: Identies closed connections between the primary system and a secondary system. If
connections are closed, the primary system is no longer being replicated.
Category: Availability
User Action: Investigate why connections are closed (for example, network problem) and resolve the
issue.
Further information: SAP HANA Administration Guide
ID: 79
Name: Conguration consistency of systems in system replication setup
Description: Identies conguration parameters that do not have the same value on the primary system
and a secondary system. Most conguration parameters should have the same value on
both systems because the secondary system has to take over in the event of a disaster.
Category: Conguration
User Action: If the identied conguration parameter(s) should have the same value in both systems,
adjust the conguration. If dierent values are acceptable, add the parameter(s) as an
exception in global.ini/[inile_checker].
Further information: SAP HANA Administration Guide
ID: 80
Name: Availability of table replication
Description: Monitors error messages related to table replication.
Category: Availability
Unit: number of deactivated tables
Thresholds / Severity: Default threshold(s): 1
Severity level(s): 4
User Action: Determine which tables encountered the table replication error using system view M_TA-
BLE_REPLICAS, and then check the corresponding indexserver alert traces.
ID: 81
Name: Cached view size
SAP HANA Troubleshooting and Performance Analysis Guide
Alerts and the Statistics Service
PUBLIC 325
Description: Determines how much memory is occupied by cached view
Category: Memory
Unit: percent
Thresholds / Severity: Default threshold(s): 50; 75; 90
Severity level(s): 1; 2; 3
User Action: Increase the size of the cached view. In the "result_cache" section of the indexserver.ini le,
increase the value of the "total_size" parameter.
ID: 82
Name: Timezone conversion
Description: Compares SAP HANA internal timezone conversion with Operating System timezone con-
version.
Category: Conguration
Unit: days
Thresholds / Severity: Default threshold(s): 999999999; 100; 10
Severity level(s): 2; 3; 4
User Action: Update SAP HANA internal timezone tables (refer to SAP note 1932132).
Further information:
SAP Note: 1932132 Large Time Dierence Between Application Server and SAP HANA
Database
ID: 83
Name: Table consistency
Description: Reports the number of inconsistencies detected by the latest consistency check runs.
Category: Availability
Unit: errors
Thresholds / Severity: Default threshold(s): 1; 3; 4
Severity level(s): 1; 3; 4
User Action: Contact SAP support.
326 PUBLIC
SAP HANA Troubleshooting and Performance Analysis Guide
Alerts and the Statistics Service
Further information:
SAP Note: 2881922 - How to Handle HANA Alert 83 : 'Alert Table consistency'
SAP Note: 2116157 - FAQ: SAP HANA Consistency Checks and Corruptions
NOTE: Rationale for the alert interval (300 seconds / 5 minutes) vs. the collector inter-
val (1 day): "... the intention is to generate the alert shortly after the inconsistency was
detected without having any synchronization between collector and alert. Then it is about
the maximum delay we want to accept between detection of an inconsistency and the alert
generation."
ID: 84
Name: Insecure instance SSFS encryption conguration
Description: Determines whether the master key of the instance secure store in the le system (SSFS)
of your SAP HANA system has been changed. If the SSFS master key is not changed after
installation, it cannot be guaranteed that the initial key is unique.
Category: Security
User Action: Change the instance SSFS master key as soon as possible.
Further information: SAP HANA Administration Guide
ID: 85
Name: Insecure systemPKI SSFS encryption conguration
Description: Determines whether the master key of the secure store in the le system (SSFS) of your
system's internal public key infrastructure (system PKI) has been changed. If the SSFS
master key is not changed after installation, it cannot be guaranteed that the initial key is
unique.
Category: Security
User Action: Change the system PKI SSFS master key as soon as possible.
Further information: SAP HANA Administration Guide
ID: 86
Name: Internal communication is congured too openly
Description: Determines whether the ports used by SAP HANA for internal communication are securely
congured. If the "listeninterface" property in the "communication" section of the global.ini
le does not have the value ".local" for single-host systems and ".all" or ".global" for multi-
ple-host systems, internal communication channels are externally exploitable.
Category: Security
SAP HANA Troubleshooting and Performance Analysis Guide
Alerts and the Statistics Service
PUBLIC 327
User Action: The parameter [communication] listeninterface in global.ini is not set to a secure value.
Please refer to SAP Note 2183363 or the section on internal host name resolution in the SAP
HANA Master Guide.
Further information:
SAP Note: 2183363 Conguration of SAP HANA internal network
ID: 87
Name: Granting of SAP HANA DI support privileges
Description: Determines if support privileges for the SAP HANA Deployment Infrastructure (DI) are
currently granted to any database users or roles.
Category: Security
Unit: users
Thresholds / Severity: Default threshold(s): 1
Severity level(s): 2
User Action: Check if the corresponding users still need the privileges. If not, revoke the privileges from
them.
ID: 88
Name: Auto merge for column-store tables
Description: Determines if the delta merge of a table was executed successfully or not.
Category: Memory
Unit: records
Thresholds / Severity: Default threshold(s): 1; 5; 10
Severity level(s): 2; 3; 4
User Action: The delta merge was not executed successfully for a table. Check the error description in
view M_DELTA_MERGE_STATISTICS and also Indexserver trace.
ID: 89
Name: Missing volume les
Description: Determines if there is any volume le missing.
Category: Conguration
328 PUBLIC
SAP HANA Troubleshooting and Performance Analysis Guide
Alerts and the Statistics Service
User Action: Volume le missing, database instance is broken, stop immediately all operations on this
instance.
ID: 91
Name: Plan cache hit ratio
Description: Determines whether or not the plan cache hit ratio is too low.
Category: Memory
Unit: ratio
Thresholds / Severity: Default threshold(s): 0.95; 0.90
Severity level(s): 1;2
User Action: Increase the size of the plan cache. In the "sql" section of the indexserver.ini le, increase
the value of the "plan_cache_size" parameter.
ID: 92
Name: Root keys of persistent services are not properly synchronized
Description: Not all services that persist data could be reached the last time the root key change of the
data volume encryption service was changed. As a result, at least one service is running
with an old root key.
Category: Security
User Action: Trigger a savepoint for this service or ush the SSFS cache using hdbcons
ID: 93
Name: Streaming License expiry
Description: Determines how many days until your streaming license expires. Once your license expires,
you can no longer start streaming projects.
Category: Availability
Unit: day
Thresholds / Severity: Default threshold(s): 30; 14 ; 7
Severity level(s): 2; 3; 4
User Action: Obtain a valid license and install it. For the exact expiration date, see the monitoring view
M_LICENSES.
SAP HANA Troubleshooting and Performance Analysis Guide
Alerts and the Statistics Service
PUBLIC 329
ID: 94
Name: Log replay backlog for system replication secondary
Description: System Replication secondary site has a higher log replay backlog than expected.
Category: Availability
Unit: MB
Thresholds / Severity: Default threshold(s): 10240; 51200; 512000
Severity level(s): 2; 3; 4
User Action: Investigate on secondary site, why log replay backlog is increased
ID: 95
Name: Availability of Data Quality reference data (directory les)
Description: Determine the Data Quality reference data expiration dates.
Category: Availability
Unit: day
Thresholds / Severity: Default threshold(s): 30; 7 ; 1
Severity level(s): 2; 3; 4
User Action: Download the latest Data Quality reference data les and update the system. (For more
details about updating the directories, see the Installation and Conguration Guide for SAP
HANA Smart Data Integration and SAP HANA Smart Data Quality.)
Further information: SAP HANA Administration Guide
ID: 96
Name: Long-running tasks
Description: Identies all long-running tasks.
Category: Availability
Unit: seconds
Thresholds / Severity: Default threshold(s): 3600; 21600; 43200
Severity level(s): 2; 3; 4
User Action: Investigate the long-running tasks. For more information, see the task statistics tables or
views in _SYS_TASK schema and trace log.
330 PUBLIC
SAP HANA Troubleshooting and Performance Analysis Guide
Alerts and the Statistics Service
ID: 97
Name: Granting of SAP HANA DI container import privileges
Description: Determines if the container import feature of the SAP HANA Deployment Infrastructure (DI)
is enabled and if import privileges for SAP HANA DI containers are currently granted to any
database users or roles.
Category: Security
Unit: users
Thresholds / Severity: Default threshold(s): 1
Severity level(s): 3
User Action: Check if the identied users still need the privileges. If not, revoke the privileges from them
and disable the SAP HANA DI container import feature.
ID: 98
Name: LOB garbage collection activity
Description: Determines whether or not the lob garbage collection is activated.
Category: Conguration
User Action: Activate the LOB garbage collection using the corresponding conguration parameters.
ID: 99
Name: HANA version
Description: Checks the installed HANA version.
Category: Conguration
Unit: support package
Thresholds / Severity: Default threshold(s): 1
Severity level(s): 1
User Action: Please check if your SAP HANA system can be upgraded to a newer version.
ID: 101
Name: SQL access for SAP HANA DI technical users
SAP HANA Troubleshooting and Performance Analysis Guide
Alerts and the Statistics Service
PUBLIC 331
Description: Determines if SQL access has been enabled for any SAP HANA DI technical users. SAP
HANA DI technical users are either users whose names start with '_SYS_DI' or SAP
HANA DI container technical users (<container name>, <container name>#DI, <container
name>#OO).
Category: Security
Unit: users
Thresholds / Severity: Default threshold(s): 1
Severity level(s): 2
User Action: Check if the identied users ('_SYS_DI*' users or SAP HANA DI container technical users)
still need SQL access. If not, disable SQL access for these users and deactivate the users.
ID: 102
Name: Existence of system database backup
Description: Determines whether or not a system database backup exists. Without a system database
backup, your system cannot be recovered.
Category: Backup
User Action: Perform a backup of the system database as soon as possible.
ID: 103
Name: Usage of deprecated features
Description: Determines if any deprecated features were used in the last interval.
Category: 0
Unit: calls
Thresholds / Severity: Default threshold(s): 1
Severity level(s): 2
User Action: Check the view M_FEATURE_USAGE to see which features were used. Refer to SAP Note
2425002 for further information.
Further information:
SAP Note: 2425002 SAP HANA 2.0: Deprecations reported by the HANA statistics
server
ID: 104
Name: Log shipping backlog for system replication secondary
332 PUBLIC
SAP HANA Troubleshooting and Performance Analysis Guide
Alerts and the Statistics Service
Description: System Replication secondary site has a higher log shipping backlog than expected.
Category: Availability
Unit: MB
Thresholds / Severity: Default threshold(s): 1024; 10240; 51200
Severity level(s): 2; 3; 4
User Action: Investigate on primary and secondary site, why log shipping backlog is increased
ID: 105
Name: Total Open Transactions Check
Description: The check monitors the number of open transactions per service
Category: Sessions/Transactions
Unit: percent
Thresholds / Severity: Default threshold(s): 20; 50; 80
Severity level(s): 2; 3; 4
User Action: Double check if the application is closing the connection correctly, and whether the high
transaction load on the system is expected.
ID: 106
Name: ASYNC replication in-memory buer overow
Description: Checks if local in-memory buer in ASYNC replication mode runs full
Category: Availability
User Action: Check buer size, peak loads, network, IO on secondary
ID: 109
Name: Backup history broken
Description: If the backup history is broken, the log_mode is internally set to overwrite, it is not ensured
that the service is fully recoverable via backup.
Category: Backup
User Action: Perform a data backup as soon as possible to ensure that the service is fully recoverable.
SAP HANA Troubleshooting and Performance Analysis Guide
Alerts and the Statistics Service
PUBLIC 333
ID: 110
Name: Catalog Consistency
Description: Identies the number of errors and aected objects detected by _SYS_STATISTICS.Collec-
tor_Global_Catalog_Consistency.
Category: Availability
Unit: errors
Thresholds / Severity: Default threshold(s): 1; 3; 4
Severity level(s): 1; 3; 4
User Action: Contact SAP support.
ID: 111
Name: Replication status of Replication Log
Description: Check whether the status of replication log is disabled.
Category: Availability
User Action: Truncate replication log table and enable replication log.
ID: 113
Name: Host open le count
Description: Determines what percentage of total open le handles are in use. All processes are
considered, including non-SAP HANA processes. Compare M_HOST_RESOURCE_UTI-
LIZATION.OPEN_FILE_COUNT with M_HOST_INFORMATION.VALUE of M_HOST_INFOR-
MATION.KEY open_le_limit.
Category: Conguration
Unit: percent
Thresholds / Severity: Default threshold(s): 95; 98; 100
Severity level(s): 2; 3; 4
User Action: This is normal behavior and neither a SAP HANA nor a Linux issue.
1. Check the current maximum number of allowed le handles: cat /proc/sys/fs/
file-max
2. Extend maximum number of le handles in /etc/sysctl.conf: fs.file-max
= 20000000
3. Activate changes for operating system: sysctl -p /etc/sysctl.conf
334 PUBLIC
SAP HANA Troubleshooting and Performance Analysis Guide
Alerts and the Statistics Service
ID: 114
Name: Host active async io count
Description: Determines what percentage of total asynchronous input/output requests are in use.
All processes are considered, including non-SAP HANA processes. Compare M_HOST_RE-
SOURCE_UTILIZATION.ACTIVE_ASYNC_IO_COUNT with M_HOST_INFORMATION.VALUE
of M_HOST_INFORMATION.KEY async_io_limit.
Category: Conguration
Unit: percent
Thresholds / Severity: Default threshold(s): 95; 98; 100
Severity level(s): 2; 3; 4
User Action: See SAP Note 1868829
Further information:
SAP Note: 1868829 Startup Issues Because Number of Active I/O Requests to Queue
Exceeds aio-max-nr Limit
ID: 115
Name: Timezone environment variable verication
Description: Determines if the timezone environment variable TZ can be interpreted. See M_TIME-
ZONE_ALERTS. Otherwise HANA falls back to a system call which can cause signicant
performance issues.
Category: Conguration
User Action: Please set the timezone environment variable TZ to a valid value according to the POSIX
documentation and restart the HANA database. See also SAP Note 2100040.
Further information:
SAP Note: 2100040 FAQ: SAP HANA CPU
ID: 117
Name: Record count of non-partitioned column-store tables (include)
Description: Determines the number of records in non-partitioned column-store tables (only include
tables are checked). Current table size may not be critical. Partitioning need only be consid-
ered if tables are expected to grow rapidly (a non-partitioned table cannot contain more
than 2,147,483,648 (2 billion) rows).
Category: Memory
Unit: records
SAP HANA Troubleshooting and Performance Analysis Guide
Alerts and the Statistics Service
PUBLIC 335

Thresholds / Severity: Default threshold(s): 300000000
Severity level(s): 1
User Action: Consider partitioning the table only if you expect it to grow rapidly.
ID: 126
Name: Check availability of remote table replicaion
Description: Monitor whether the replication status of RTR tables has turned to be DISABLED.
Category: Availability
User Action: Check error message with a view M_REMOTE_TABLE_REPLICAS
ID: 127
Name: Record count of column-store table partitions (include)
Description: Determines the number of records in the partitions of column-store tables (only include
tables are checked). A table partition cannot contain more than 2,147,483,648 (2 billion)
rows.
Category: Memory
Unit: records
Thresholds / Severity: Default threshold(s): 1500000000; 1800000000; 1900000000
Severity level(s): 2; 3; 4
User Action: Consider repartitioning the table.
ID: 128
Name: LDAP Enabled Users without SSL
Description: Checks for the vulnerability where users may be enabled for LDAP Authentication but SSL is
not enabled for the communication from HANA client (odbc/jdbc/hdbsql) to the HANA DB.
Category: Security
User Action: Congure SSL to reduce risk of man-in-the-middle attacks and privacy protection.
336 PUBLIC
SAP HANA Troubleshooting and Performance Analysis Guide
Alerts and the Statistics Service

Further information: The alert is triggered when any user in view SYS.USERS is enabled for LDAP by having
IS_LDAP_ENABLED set to 'TRUE' and the communication from HANA client (odbc/jdbc/
hdbsql) to the HANA DB is not encrypted: global.ini [communication] ssl=o. The alert is
not relevant for connections from HANA DB to the LDAP directory server.
See: Server-Side TLS/SSL Conguration Properties for Internal Communication (SAP
HANA Security Guide for SAP HANA Platform)
ID: 129
Name: Check trusted certicate expiration date
Description: Determines if there are any trusted certicates that will expire soon or have already expired.
The trusting certicate collection must have a purpose set.
Category: Security
Unit: day
Thresholds / Severity: Default threshold(s): 30
Severity level(s): 3
User Action: Replace the certicates.
ID: 130
Name: Check own certicate expiration date
Description: Determines if there are any own or chain certicates that will expire soon or have already
expired. The owning certicate collection must have a purpose set.
Category: Security
Unit: day
Thresholds / Severity: Default threshold(s): 30; 14
Severity level(s): 3; 4
User Action: Replace the certicates.
ID: 131
Name: Session requests queued by admission control
Description: Determines the number of session requests waiting in the admission control queue. This
can indicate an issue with the response time of the request.
Category: Availability
SAP HANA Troubleshooting and Performance Analysis Guide
Alerts and the Statistics Service
PUBLIC 337
Unit: count
Thresholds / Severity: Default threshold(s): 1
Severity level(s): 4
User Action: Investigate why the session requests newly queued by admission control. Refer to M_AD-
MISSION_CONTROL_EVENTS for more information.
ID: 132
Name: Session requests rejected by admission control
Description: Determines the number of session requests newly rejected by admission control. This can
indicate an issue with the availability of the database.
Category: Availability
Unit: count
Thresholds / Severity: Default threshold(s): 1
Severity level(s): 4
User Action: Investigate why the session requests newly rejected by admission control. Refer to M_AD-
MISSION_CONTROL_EVENTS for more information.
ID: 133
Name: Check out-of-buers event for a buer cache
Description: Checks whether a buer cache is suciently congured. An out-of-buers event indicates
that the aected buer cache is insuciently congured for the current workload. It should
be resolved, otherwise queries may fail.
Category: Conguration
User Action: Resolve the out-of-buers event by increasing the max_size parameter of the aected buer
cache.
ID: 134
Name: Administration of SAP HANA DI user groups by user administrators
Description: Determines if any SAP HANA DI user groups can be managed by a user with the USER
ADMIN system privilege. SAP HANA DI user groups are user groups whose names start with
'_SYS_DI#'.
Category: Security
338 PUBLIC
SAP HANA Troubleshooting and Performance Analysis Guide
Alerts and the Statistics Service
Unit: user groups
Thresholds / Severity: Default threshold(s): 1
Severity level(s): 2
User Action: Verify that the identied user groups still need to be able to be managed by users with the
USER ADMIN system privilege. If they don't, disable USER ADMIN administration for these
user groups (ALTER USERGROUP <usergroup_name> DISABLE USER ADMIN).
ID: 136
Name: Unsupported conguration parameter values
Description: Checks if conguration parameters are set to unsupported values
Category: Conguration
User Action: Check if system is running in a supported state
ID: 137
Name: Restart required after conguration change
Description: Checks if services require a restart after a conguration was changed
Category: Conguration
User Action: Restart services (see M_CONFIGURATION_PARAMETER_VALUES) to allow the changed
conguration to become active.
ID: 140
Name: License Usage Type in Production System
Description:
Checks that property license_usage in section system_information is not unde-
ned when property usage in section system_information is set to production in
global.ini.
Category: Conguration
User Action:
Set property license_usage in section system_information for production sys-
tems.
ID: 141
Name: Checking system logging is enabled.
SAP HANA Troubleshooting and Performance Analysis Guide
Alerts and the Statistics Service
PUBLIC 339
Description:
While logging is disabled, no log entries persist; only the data area is written when a save-
point is reached. This behavior can cause the loss of committed transactions when the
indexserver terminates in the middle of a LOAD operation. In case of a termination, truncate
and insert all data again.
Category: Conguration
User Action:
Enable system logging with ALTER SYSTEM LOGGING ON; and perform a savepoint.
ID: 143
Name: Enable automatic log backup fallback for third-party backup tools
Description: Indicates the following:
• Automatic log backup fallback is enabled.
• Log backup fallback is activated.
Log backups are being written to the le system instead of to the external storage
system.
Category: Backup and Recovery
User Action: The external storage system appears to be unavailable, as log backups are being written to a
fallback destination in the le system.
User action:
• Check whether the external storage system is unavailable due to a planned downtime.
• Otherwise, investigate why the external storage system is not available.
Further Information: SAP HANA Administration Guide Backup and Recovery > Automatic Log Backup Fallback for
Third-Party Backup Tools
ID: 144
Name: Checks if table logging is disabled
Description:
While table logging is disabled, no DML specic log entries are persisted: only the tables
data area is written when a savepoint is reached. This behavior might cause data loss of
committed DML transactions when these tables need to be recovered (including system
replication). In such a case table needs to be truncated and all data needs to be inserted
again.
Category: Conguration
User Action:
Enable table logging with ALTER TABLE ... ENABLE DELTA LOG.
Further Information:
SAP Note: 1999930 FAQ: SAP HANA I/O Analysis
ID: 145
Name: Nameserver Topology Inconsistencies
340 PUBLIC
SAP HANA Troubleshooting and Performance Analysis Guide
Alerts and the Statistics Service
Description:
This alert checker evaluates the landscape topology dened on the SYSTEMDB (Name-
server). If inconsistencies are found then a warning alert is raised.
User Action: Contact SAP support.
Further Information:
SAP Note: 3246723 - How to handle HANA Alert 145: Nameserver Topology Inconsisten-
cies
ID: 146
Name: Table Consistency Status
Description:
Checks the view CONSISTENCY_CHECK_HISTORY_ERRORS and reports the number of
errors in tables with inconsistencies. Severity ERROR is reported as a MEDIUM level alert,
Severity HIGH is reported as a HIGH level alert. See also Alert 83 which only triggers an alert
if errors are found and there is a change in the number of errors.
Category: Availability
Unit: errors
User Action: Contact SAP support.
Further Information:
SAP Note: 2116157 - FAQ: SAP HANA Consistency Checks and Corruptions
ID: 148
Name: TLS not congured for external communication (ODBC/JDBC)
Description:
The SQL Port for external communication of ODBC/JDBC connections is not properly
congured for TLS. Secured connections are not possible.
Category: Security
User Action: Congure TLS for external communication by creating a certicate collection with the pur-
pose SSL and providing a certicate. See SAP Note 'How-To Series - HANA and SSL / TLS'.
Further Information:
SAP Note: 2487639 How-To Series - HANA and SSL / TLS
ID: 151
Name: HANA/KMS failed connection situation
Description:
Identies a HANA connectivity issue between the local secure store (LSS) and an external
key management system (KMS).
Category: Security, security key management
Thresholds / Severity: Default threshold(s): 5 minutes; 30 minutes; 180 minutes
Severity level(s): 2; 3; 4
SAP HANA Troubleshooting and Performance Analysis Guide
Alerts and the Statistics Service
PUBLIC 341
User Action: Report external incident.
Further Information:
SAP Note: 3460034 Troubleshoot: HANA/KMS Connection Failure Alert
ID: 500
Name: Dbspace usage
Description: Checks for the dbspace size usage.
Category: Disk
Unit: percent
Thresholds / Severity: Default threshold(s): 90; 95; 98
Severity level(s): 2; 3; 4
User Action: Investigate the usage of dbspace and increase the size.
ID: 501
Name: Dbspace status
Description: Determines whether or not all dbspaces are available.
Category: Availability
User Action: Investigate why the dbspace is not available.
ID: 502
Name: Dbspace le status
Description: Determines whether or not all dbspace les are available.
Category: Availability
User Action: Investigate why the dbspace le is not available.
ID: 504
Name: DT Version mismatch
Description: Checks that dynamic tiering and SAP HANA versions match.
Category: Availability
User Action: Check the reason for the mismatch, and correct the problem. See SAP Note 2637835.
342 PUBLIC
SAP HANA Troubleshooting and Performance Analysis Guide
Alerts and the Statistics Service
Further information:
SAP Note: 2637835 Dynamic Tiering Version does not Match SAP HANA Version
ID: 505
Name: ES backup history broken
Description: If the backup history is broken, the service is not fully recoverable via backup.
Category: Backup
User Action: Perform a data backup as soon as possible to ensure that the service is fully recoverable.
ID: 600
Name: Inactive Streaming applications
Description: Identies inactive Streaming applications.
Category: Availability
Unit: seconds
Thresholds / Severity: Default threshold(s): 60
Severity level(s): 4
User Action: Investigate why the Streaming application is inactive, for example, by checking the Stream-
ing application's trace les.
ID: 601
Name: Inactive Streaming project managed adapters
Description: Identies inactive Streaming project managed adapters.
Category: Availability
Unit: seconds
Thresholds / Severity: Default threshold(s): 60
Severity level(s): 4
User Action: Investigate why the Streaming project managed adapter is inactive, for example, by check-
ing the trace les.
ID: 602
Name: Streaming project physical memory usage
SAP HANA Troubleshooting and Performance Analysis Guide
Alerts and the Statistics Service
PUBLIC 343

Description: Determines what percentage of total physical memory available on the host is used for the
streaming project.
Category: Memory
Unit: percent
Thresholds / Severity: Default threshold(s): 80; 85; 90
Severity level(s): 2; 3; 4
User Action: Investigate memory usage of the streaming project.
ID: 603
Name: Streaming project CPU usage
Description: Determines the percentage CPU usage for a streaming project on the host and therefore
whether or not CPU resources are running out.
Category: CPU
Unit: percent
Thresholds / Severity: Default threshold(s): 80; 90; 95
Severity level(s): 2; 3; 4
User Action: Investigate CPU usage.
ID: 604
Name: Number of publishers of streaming project
Description: Identify the large publishers of streaming project. Make sure that they will not break the
streaming project.
Category: Conguration
Unit: count
Thresholds / Severity: Default threshold(s): 100000 ;1000000; 10000000
Severity level(s): 2; 3; 4
User Action: Investigate whether these publishers are created intentionally.
ID: 605
Name: Number of subscribers of streaming project
344 PUBLIC
SAP HANA Troubleshooting and Performance Analysis Guide
Alerts and the Statistics Service
Description: Identify the large subscribers of streaming project. Make sure that they will not break the
streaming project.
Category: Conguration
Unit: count
Thresholds / Severity: Default threshold(s): 100000 ;1000000; 10000000
Severity level(s): 2; 3; 4
User Action: Investigate whether these subscribers are created intentionally.
ID: 606
Name: Row throughput of subscriber of streaming project
Description: Identify which subscriber of streaming project has low throughput measured in rows per
second.
Category: Conguration
Unit: rows per sec
Thresholds / Severity: Default threshold(s): 1000
Severity level(s): 2
User Action: Investigate why the subscriber works slowly.
ID: 607
Name: Transaction throughput of subscriber of streaming project
Description: Identify which subscriber of streaming project has transaction throughput measured in
transactions per second.
Category: Conguration
Unit: transactions per sec
Thresholds / Severity: Default threshold(s): 1000
Severity level(s): 2
User Action: Investigate why the subscriber works slowly.
ID: 608
Name: Row throughput of publisher of streaming project
SAP HANA Troubleshooting and Performance Analysis Guide
Alerts and the Statistics Service
PUBLIC 345
Description: Identify which publisher of streaming project has low throughput measured in rows per
second.
Category: Conguration
Unit: rows per sec
Thresholds / Severity: Default threshold(s): 1000
Severity level(s): 2
User Action: Investigate why the publisher works slowly.
ID: 609
Name: Transaction throughput of publisher of streaming project
Description: Identify which publisher of streaming project has transaction throughput measured in
transactions per second.
Category: Conguration
Unit: transactions per sec
Thresholds / Severity: Default threshold(s): 1000
Severity level(s): 2
User Action: Investigate why the publisher works slowly.
ID: 610
Name: Bad rows of project managed adapter
Description: Identify which project managed adapter has much rows with error.
Category: Conguration
Unit: row
Thresholds / Severity: Default threshold(s): 100
Severity level(s): 2
User Action: Investigate why the adapter has such much rows with error.
ID: 611
Name: High latency of project managed adapter
Description: Identify which project managed adapter has high latency.
346 PUBLIC
SAP HANA Troubleshooting and Performance Analysis Guide
Alerts and the Statistics Service

Category: Conguration
Unit: microsecond
Thresholds / Severity: Default threshold(s): 1000000
Severity level(s): 2
User Action: Investigate why the adapter has high latency.
ID: 612
Name: Large queue of stream of streaming project
Description: Identify which stream of streaming project has large queue.
Category: Conguration
Thresholds / Severity: Default threshold(s): 1000
Severity level(s): 2
User Action: Investigate why the stream has large queue.
ID: 613
Name: Large store of stream of streaming project
Description: Identify which stream of streaming project has large store.
Category: Conguration
Unit: row
Thresholds / Severity: Default threshold(s): 10000
Severity level(s): 2
User Action: Investigate why the stream has large store.
ID: 700
Name: Agent availability
Description: Determines how many minutes the agent has been inactive.
Category: Availability
Unit: minutes
SAP HANA Troubleshooting and Performance Analysis Guide
Alerts and the Statistics Service
PUBLIC 347

Thresholds / Severity: Default threshold(s): 2; 4; 5
Severity level(s): 2; 3; 4
User Action: Investigate connection of agent and check if agent is up and running.
ID: 701
Name: Agent memory usage
Description: Determines what percentage of total memory available to agent is used.
Category: Memory
Unit: percent
Thresholds / Severity: Default threshold(s): 80; 90; 95
Severity level(s): 2; 3; 4
User Action: Investigate which adapter or processes use a lot of memory.
ID: 710
Name: Remote Subscription exception
Description: Checks for recent exceptions in remote subscriptions and remote sources.
Category: Availability
User Action: Investigate the error message and the error code and restart the remote subscription if
necessary.
ID: 711
Name: Remote subscription queued time
Description: Check for how long the remote subscriptions have been in a queued state.
Category: Availability
Unit: hours
Thresholds / Severity: Default threshold(s): 24; 48; 72
Severity level(s): 2; 3; 4
User Action: Investigate Data Provisioning Agent and Data Provisioning Server logs to check for errors,
whether distribute command was executed and whether begin and end markers have been
sent back by the Agent.
348 PUBLIC
SAP HANA Troubleshooting and Performance Analysis Guide
Alerts and the Statistics Service
ID: 712
Name: Remote source not receiving change data
Description: Check how long since Data Provisioning server last received change data from source
database.
Category: Availability
Unit: hours
Thresholds / Severity: Default threshold(s): 24; 48; 72
Severity level(s): 2; 3; 4
User Action: Check if there are any errors reported for this remote source in REMOTE_SUBSCRIP-
TION_EXCEPTIONS table and if there is change data for the subscribed tables in the source
database that should have been replicated. Use START LATENCY MONITORING to monitor
replication latency.
ID: 713
Name: Remote source applier delayed time
Description:
A remote source has a delay in applying changes to the data. The time value calculation
is derived from timestamp values in the view m_remote_source_statistics: the dierence
between the last received timestamp and the last applied timestamp.
Category: Smart data integration
Thresholds / Severity: Default threshold(s): 4 hours; 8 hours; 12 hours
Severity level(s): 2; 3; 4
User Action: Indicates a potential performance issue while applying change data.
Further information:
SAP Note: 3159071 Check for SDI Applier Delay too long
ID: 990
Name: System Replication support issue in ESS
Description: Identies issues while initializing System Replication support in the Embedded Statistics
Server (ESS).
Category: Availability
User Action: System replication support has been deactivated in ESS. Check the trace les for issues
with System Replication.
SAP HANA Troubleshooting and Performance Analysis Guide
Alerts and the Statistics Service
PUBLIC 349
7 SAP HANA SQLDBC Error Codes
Error code reference for SQLDBC.
When using Netweaver to connect dierent SQLDBC libraries to databases such as SAP HANA it can be helpful
to have a short description for the various error codes. The following table is a list of SAP HANA SQLDBC Error
Codes which may be reported by the client.
For explanations and solutions to common client-side errors see Note: 2393013 FAQ: SAP HANA Clients,
section: '12. What are typical explanations and solutions for client-side errors?'
Environment, Tracing, Filehandling 10000 - 10099
Code Description
-10803 "Allocation of shared memory failed \"%s\" of size %d failed"
-10803 "Allocation of shared memory failed (%s)"
-10808 "Feature (%s) not implemented yet in module: %s line: %d"
-10001 "System error: %s."
-10003 "Feature not supported for kernel version %d"
-10810 "Session already in use"
Connection 10100 - 10199
Code Description
-10807 "Connection down: [%d] %.*s"
-10857 "Missing database name for connection"
-10715 "Missing user name for connection"
-10715 "Missing password for connection"
-10709 "Connection failed (%s:%s)"
-10709 "Connection failed (%s:[%d] %s)"
-10709 "Data format \'%s\' not supported by the engine"
-10709 "Connection failed"
-10100 "Invalid value for option \'%s\' of SQLDBC_ConnectProperties"
-10101 "Invalid value for ISOLATIONLEVEL (%s)"
350 PUBLIC
SAP HANA Troubleshooting and Performance Analysis Guide
SAP HANA SQLDBC Error Codes

Code Description
-10101 "Invalid value for ISOLATIONLEVEL (%d)"
-10102 "Invalid value for PACKETCOUNT (%s)"
-10103 "Invalid value for STATEMENTCACHESIZE (%s)"
-10104 "Invalid value for KEY"
-10104 "Invalid value for KEY (%s)"
-10105 01S02 "Codepage not supported (%s)"
-10106 "Invalid client application id (%s)"
-10757 "Secure store error: %s:%d - (%d) %s"
-10757 "XUSER error (%s)"
-10107 "Authentication failed."
-10107 "Authentication failed (%s)."
-10108 "Session has been reconnected."
-10709 "Connection failed (no reachable host left)"
API handling 10200 - 10299
Code Description
-10200 HY010 "Function sequence error (data for execution expected)"
-10201 HY010 "Function sequence error (no data for execution expected)"
-10202 HY010 "Function sequence error (operation was aborted by disconnect)"
-10210 HY010 "Invalid command state (No prepared SQL command)"
-10220 HY010 "Calling %s is not allowed for %s."
-10221 HY010 "Command info to long [length is %d maximum length %d]"
Parameter, Column handling 10300 - 10399
Code Description
-10300 07009 "Invalid parameter index"
-10300 07009 "Invalid parameter index %d"
-10300 07009 "Invalid parameter index 0"
SAP HANA Troubleshooting and Performance Analysis Guide
SAP HANA SQLDBC Error Codes
PUBLIC 351

Code Description
-10301 "Invalid host type (%s) for parameter (%d)"
-10304 07002 "Parameter/Column (%d) not bound."
-10305 HY090 "Parameter (%d) contains null pointer"
-10306 HY090 "Negative buer length for parameter (%d) not allowed (found %d)"
-10307 HY090 "Invalid length or indicator value for parameter (%d)"
-10308 HY019 "Non-character and non-binary data for parameter (%d) for piece wise insert not
allowed"
-10310 07009 "Invalid column index (%d)"
-10312 HY020 "Attempt to concatenate to a NULL or DEFAULT value for parameter (%d)"
-10313 HY010 "Requested parameter (%d) was already processed"
-10314 HY010 "Invalid parameter processing sequence process" #
-10315 "Invalid start position (%d)"
-10316 HY010 "DATA AT EXECUTE for parameter (%d) not allowed (conicts "
-10317 HY010 "LOB type for parameter (%d) not allowed (conicts "
-10318 HY010 "Invalid LOB object"
-10319 HY010 "Could not read LOB for parameter/column (%d)"
-10319 HY010 "Could not write write LOB for parameter/column (%d)"
-10320 HY010 "LOB already closed LOB for parameter/column (%d)"
-10320 HY010 "LOB is closed by transaction end"
-10321 HY010 "LOB invalidated by a previous error for "
-10322 HY010 "Could not insert LOB." " Parameter/column (%d) has a NULL/DEFAULT value"
-10323 HY019 "Non-character and non-binary data for parameter/column (%d) was "
-10861 HY010 "Invalid use of null pointer for stream handle in parameter (%d)"
-10324 HY010 "Stream with id (%d) not found"
-10325 HY010 "Stream parameter (%d) is not an input parameter (callback missing)"
-10325 HY010 "Stream parameter (%d) is not an output parameter (callback missing)"
352 PUBLIC
SAP HANA Troubleshooting and Performance Analysis Guide
SAP HANA SQLDBC Error Codes
Code Description
-10862 HY010 "Stream parameter (%d) error (%d) in read procedure"
-10862 HY010 "Stream parameter (%d) error in write procedure"
-10326 HY010 "No data found for stream (%d) but data was expected"
-10327 HY010 "Invalid use of null pointer in stream parameter eld " "of stream descriptor for
parameter/column (%d)"
-10328 HY010 "Mismatch of number of stream members for parameter (%d) "
-10329 HY010 "Invalid serial value requested must be rst or last value."
-10330 HY010 "Multiple stream output sequence error unexpected '%s' part."
-10331 HY010 "Input stream callback buer overow for table id %d " "allowed %d written %d
bytes."#
-10332 HY010 "No callback function supplied for stream parameter %d."
-10333 "Unsupported database type in parameter/column (%d)."
-10334 HY010 "No BLOB/CLOB for DATA AT EXECUTE currently supported as procedure pa-
rameter (%d)."
-10335 HY010 "Cannot use BLOB/CLOB parameter %d before parameter %d is processed."
-10336 HY010 "Switch between dierent BLOB/CLOB parameters in procedure not supported."
-10337 HY010 "Cannot set keep-alive mode for LOB parameter (%d)."
-10338 HY010 "Cannot use an uninitialized LOB object for copy in parameter (%d)."
-10339 HY010 "Cannot copy LOB from other connection in parameter (%d)."
-10340 HY010 "Cannot copy LOB of dierent types onto each other for parameter (%d)."
-10341 "Cannot use LOB copy semantics for database procedures in parameter (%d)."
-10342 HY010 "Invalid or too long LOB search pattern"
-10343 HY010 "LOB parameter not supported for database procedure"
-10345 HY010 "LOB parameter type unsupported in array commands (parameter %d)"
-10346 "ABAP stream handling error"
SAP HANA Troubleshooting and Performance Analysis Guide
SAP HANA SQLDBC Error Codes
PUBLIC 353

Data Conversion 10400 - 10499
Code Description
-10400 "Conversion looses signicant digits for parameter/column (%d)"
-10401 "Conversion of parameter/column (%d) would truncate data"
-10811 "Numeric overow for parameter/column (%d) source type %s target type %s
value '%s'"
-10802 "Invalid numeric value for parameter/column (%d) source type %s target type
%s"
-10404 "Conversion not supported for parameter/column (%d) source type %s and tar-
get type %s"
-10405 "Cannot convert UCS2 data to ASCII for parameter/column (%d)"
-10406 "Invalid data length for UCS2 data for parameter/column (%d)"
-10407 "Corrupted UTF8 data for parameter/column (%d)"
-10408 "Character conversion failed"
-10410 22007 "Date/Time format is not supported for parameter (%d)"
-10411 "Illegal DATE value for parameter/column (%d)"
-10412 "Illegal TIME value for parameter/column (%d)"
-10413 "Illegal TIMESTAMP value for parameter/column (%d)"
-10414 "Conversion from binary value to string is not enabled for " "parameter/column
(%d)"
-10415 "Indicator must not be a null pointer for DECIMAL input value " " for parame-
ter/column (%d)"
-10416 "Invalid indicator value for DECIMAL input value for " " parameter/column (%d)"
-10417 "Invalid denition for DECIMAL input value for paramater/column "
-10418 "Buer for DECIMAL too short for parameter/column (%d)"
-10419 "Character value contains non-ASCII characters (%d)"
-10420 "Could not convert byte buer to hexadecimal string for " "parameter/column
(%d)"
-10421 "Could not convert too large LONG data for parameter/column (%d)"
-10422 01004 "Appending data to binary output not supported for parameter/column (%d)"
354 PUBLIC
SAP HANA Troubleshooting and Performance Analysis Guide
SAP HANA SQLDBC Error Codes
Code Description
-10423 22003 "Appending data to binary output not supported for numeric parameter/column
(%d)"
-10424 22003 "Conversion from %s data to binary would truncate data for parameter/column
(%d)"
-10425 "Search pattern is too long for parameter/column (%d)"
-10426 "Internal error: No data available at column (%d)"
-10427 "Conversion of parameter (%d) to %s failed"
-10427 "Conversion of parameter (%d) from data type %s to %s failed"
-10427 "Conversion of parameter (%d) from data type %s to %s failed (%s)"
-10427 "Conversion of character parameter (%d) failed with return code %d"
-10428 "Unsupported length %d of decimal oat parameter/column (%d)"
Retrieving results and array commands 10500 - 10599
Code Description
100 02000 "Row not found"
-10500 "Result set is closed"
-10500 "Result set is closed (transaction end)"
-10501 S1109 "Invalid position in resultset: before rst row"
-10502 S1109 "Invalid position in resultset: after last row"
-10503 "The operation is not allowed for result set type FORWARD_ONLY"
-10504 "Invalid position (%d) for rowset"
-10505 "Result set type is UPDATABLE but row set type is READ_ONLY."
-10506 "Result set type is READ_ONLY but row set type is UPDATABLE"
-10507 "Internal error: No metadata available for rowset operation"
-10508 "Invalid encoding of column name for column %d for rowset operation"
-10509 "The statement was not executed with updatable cursor concurrency"
-10511 "No error available for given row number"
-10856 "Invalid row array size 0"
SAP HANA Troubleshooting and Performance Analysis Guide
SAP HANA SQLDBC Error Codes
PUBLIC 355

Code Description
-10510 21S02 "Degree of derived table does not match column list"
-10512 "Row not processed due to previous error"
Statement execution 10600 - 10699
Code Description
-10821 "Session not connected"
-10601 "SQL command is the empty string"
-10602 "SQL command contains UNICODE character"
-10603 "SQL command would generate a result set"
-10604 "SQL command contains output parameters"
-10706 "Statement too long"
-10605 "Illegal schema modication parameters/columns have changed type/number
incompatibly"#
-10689 "Assertion error: %s"
-10690 "Selected column (%d) is not referenced by any itab target eld"
-10691 "selected column (%d) is referenced by more than one itab target eld"
-10692 "DB type (%d) of selected column (%d) and ABAP type %s (%d) of target eld
(%d) are not compatible"
-10693 "Itab target eld (%d) references the invalid column position (%d)"
-10694 "Itab target eld (%d) denes an unsupported ABAP type %s (%d): initial value
creation not possible"
-10695 "Illegal function code (%d): itab select on a non query prepared statement is not
allowed"
-10696 "Illegal function code (%d): itab insert on a non insert prepared statement is not
allowed"
-10697 "Illegal initial eld (%d): initial elds are not supported in itab insert operations"
-10698 "Input parameters must not be bound in this context"
-10699 "Unsupported protocol version: major=%d minor=%d"
-10901 "No space left in request packet"
356 PUBLIC
SAP HANA Troubleshooting and Performance Analysis Guide
SAP HANA SQLDBC Error Codes
Code Description
-10902 "Invalid request packet structure"
-10903 "Internal Error: LONGDATA part expected"
-10904 "Internal error: Expected result count"
-10905 "Invalid reply packet structure"
-10906 "Internal Error: Entry for valindex %d not found"
-10907 "Internal Error: Long descriptor has error ag set"
-10908 "Internal Error: GETVAL operation required before data could be read"
Fatal errors 10900 - 10999
Code Description
-10910 HY001 "Internal Error: Unhandled exception %s:%d - (%d) %s"
-10911 "Internal Error: Missing LOB locator id"
-10912 "Internal Error: Too many LOB locator ids found (%d)"
-10913 "Internal Error: No LOB locator id found for index (%d)"
-10914 "Data for output parameters missing"
-10915 "Internal Error: Invalid number of row counts returned (%d expected %d)"
-10916 "Internal Error: Error signalled but no message returned from server"
-10917 "Internal Error: Incomplete result description of multiple result sets received"
-10918 "Internal Error: No LOB data received requested LOB at position %d for %d
bytes"
-10919 "Internal Error: No transaction identier found"
SAP HANA Troubleshooting and Performance Analysis Guide
SAP HANA SQLDBC Error Codes
PUBLIC 357
8 Important Disclaimer for Features in SAP
HANA
For information about the capabilities available for your license and installation scenario, refer to the Feature
Scope Description for SAP HANA.
358 PUBLIC
SAP HANA Troubleshooting and Performance Analysis Guide
Important Disclaimer for Features in SAP HANA

Important Disclaimers and Legal Information
Hyperlinks
Some links are classied by an icon and/or a mouseover text. These links provide additional information.
About the icons:
• Links with the icon
: You are entering a Web site that is not hosted by SAP. By using such links, you agree (unless expressly stated otherwise in your
agreements with SAP) to this:
• The content of the linked-to site is not SAP documentation. You may not infer any product claims against SAP based on this information.
• SAP does not agree or disagree with the content on the linked-to site, nor does SAP warrant the availability and correctness. SAP shall not be liable for any
damages caused by the use of such content unless damages have been caused by SAP's gross negligence or willful misconduct.
• Links with the icon : You are leaving the documentation for that particular SAP product or service and are entering an SAP-hosted Web site. By using
such links, you agree that (unless expressly stated otherwise in your agreements with SAP) you may not infer any product claims against SAP based on this
information.
Videos Hosted on External Platforms
Some videos may point to third-party video hosting platforms. SAP cannot guarantee the future availability of videos stored on these platforms. Furthermore, any
advertisements or other content hosted on these platforms (for example, suggested videos or by navigating to other videos hosted on the same site), are not within
the control or responsibility of SAP.
Beta and Other Experimental Features
Experimental features are not part of the ocially delivered scope that SAP guarantees for future releases. This means that experimental features may be changed by
SAP at any time for any reason without notice. Experimental features are not for productive use. You may not demonstrate, test, examine, evaluate or otherwise use
the experimental features in a live operating environment or with data that has not been suciently backed up.
The purpose of experimental features is to get feedback early on, allowing customers and partners to inuence the future product accordingly. By providing your
feedback (e.g. in the SAP Community), you accept that intellectual property rights of the contributions or derivative works shall remain the exclusive property of SAP.
Example Code
Any software coding and/or code snippets are examples. They are not for productive use. The example code is only intended to better explain and visualize the syntax
and phrasing rules. SAP does not warrant the correctness and completeness of the example code. SAP shall not be liable for errors or damages caused by the use of
example code unless damages have been caused by SAP's gross negligence or willful misconduct.
Bias-Free Language
SAP supports a culture of diversity and inclusion. Whenever possible, we use unbiased language in our documentation to refer to people of all cultures, ethnicities,
genders, and abilities.
SAP HANA Troubleshooting and Performance Analysis Guide
Important Disclaimers and Legal Information
PUBLIC 359

www.sap.com/contactsap
© 2024 SAP SE or an SAP aliate company. All rights reserved.
No part of this publication may be reproduced or transmitted in any form
or for any purpose without the express permission of SAP SE or an SAP
aliate company. The information contained herein may be changed
without prior notice.
Some software products marketed by SAP SE and its distributors
contain proprietary software components of other software vendors.
National product specications may vary.
These materials are provided by SAP SE or an SAP aliate company for
informational purposes only, without representation or warranty of any
kind, and SAP or its aliated companies shall not be liable for errors or
omissions with respect to the materials. The only warranties for SAP or
SAP aliate company products and services are those that are set forth
in the express warranty statements accompanying such products and
services, if any. Nothing herein should be construed as constituting an
additional warranty.
SAP and other SAP products and services mentioned herein as well as
their respective logos are trademarks or registered trademarks of SAP
SE (or an SAP aliate company) in Germany and other countries. All
other product and service names mentioned are the trademarks of their
respective companies.
Please see https://www.sap.com/about/legal/trademark.html for
additional trademark information and notices.
THE BEST RUN
